The latest signals of each model are as follows:
- Ultimate market timing model: Buy equities (upgrade)
- Trend Model signal: Bullish (upgrade)
- Trading model: Neutral
Update schedule: I generally update model readings on my site on weekends and tweet mid-week observations at @humblestudent. Subscribers receive real-time alerts of trading model changes, and a hypothetical trading record of those email alerts is shown here.
Subscribers can access the latest signal in real-time here.
The bulls test triple-top resistance
Last week, I highlighted the possible formation of a rare Zweig Breadth Thrust (ZBT) buy signal coupled with an S&P 500 test at triple-top resistance. As it turns out, equity breadth was not strong enough to trigger the ZBT buy signal. Despite making a marginal new all-time high, the S&P 500 is still effectively testing triple-top resistance.
What’s next?
A new equity bull
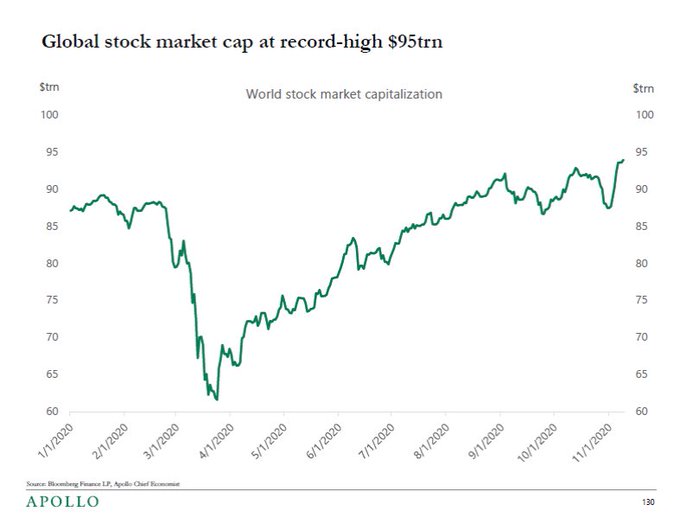
Global market cap has reached a new high. The intermediate and long term trends are bullish.
However, the short-term outlook for the S&P 500 is less certain. To be sure, breadth is positive, and the percentage of stocks above their 200 day moving averages have exceeded 80%. Past prolonged periods of strong breadth (shown in grey) are characteristics of bull phases and strong advances. On the other hand, brief flashes of strong breadth (shown in pink) have resolved in short-term tops and corrective action.
Here comes the Great Rotation
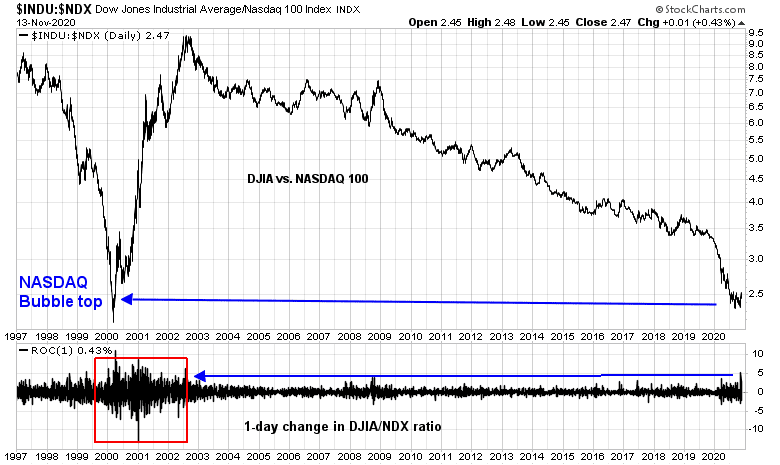
Here is how I resolve the bull and bear dilemma. Much depends on the nature of the Great Rotation from value to cyclical and value stocks. A quick way of visualizing this rotation is to analyze the DJIA (old economy cyclical) to NASDAQ 100 (growth) ratio. I see two important takeaways from this analysis.
- The ratio is at levels last seen at the top of the NASDAQ Bubble in 2000.
- The rate of daily change of this ratio is also similar to the last bubble top period.
The Great Rotation is very real, and it’s underway. If growth stocks were to crash, it’s possible the DJIA and value stocks could trade sideways as they did during the 2000-02 bear market.
However, there are important differences between the NASDAQ Bubble and the current period. The bulk of the last bubble was dominated by unprofitable internet companies trading on the hope of future cash flow and profitability, while today’s Big Tech growth stocks are mostly established incumbents with strong competitive moats and cash flows. Growth stocks today may underperform, but they are unlikely to crash in the manner of the early 2000’s.
Today’s cyclical and value stocks are poised to recover as health authorities get the pandemic under control and the growth outlook normalizes. However, the S&P 500 has a composition problem. Big Tech growth (technology, communication services, and AMZN) comprise 43.4% of S&P 500 weight, while cyclical stocks (consumer discretionary ex-AMZN, industrials, materials, and energy) are only 19.9% of index weight. It would be difficult to see how the S&P 500 can advance significantly if investors were to rotate from growth to cyclical and value.
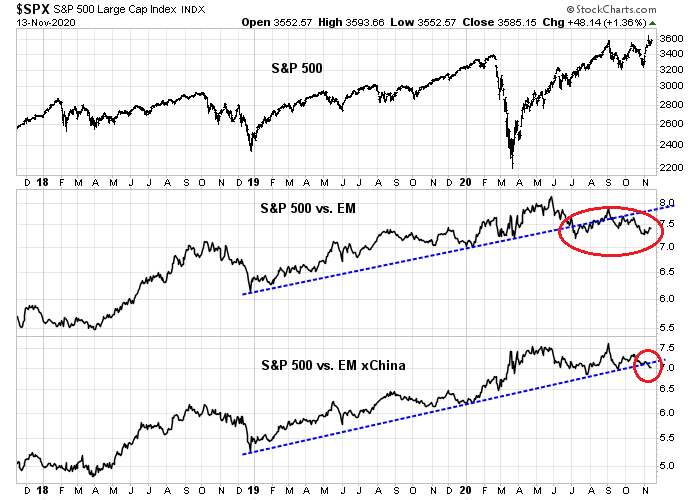
The greatest opportunities are outside the US. In particular, EM equities are showing signs of emerging leadership.
Next week’s tactical market outlook
Looking to the week ahead, the market faces a number of cross-currents. Large-cap growth stocks, as measured by QQQ, exhibited a negative OBV divergence indicating distribution. As well, it violated an important relative uptrend line. While they have staged minor rallies, the technical damage is becoming evident and a period of choppiness is likely to follow.
On the other hand, both large and small-cap value indices have gapped up. These are possible indications of bullish runaway gaps which are confirmations of the growth to value rotation. In light of the dominance of Big Tech stocks in the S&P 500, however, it’s hard to see how the S&P 500 can make much headway in the short run.
Option sentiment models are flashing warning signals. The equity put/call ratio (CPCE) is an indicator of retail sentiment, as retail investors use mostly individual stock options to express their views, while the index put/call ratio (CPCI) is indicative of institutional sentiment because institutions use index options for hedging. In the past, a heightened spread between a high CPCI and low CPCE has marked periods when the market has experienced difficulty advancing. The heightened level of anxiety can also be seen in the ratio of the VIX to EM VIX. The US market is now trading like an emerging market, as measured by implied volatility.
Despite the promising vaccine news, the global economy isn’t out of the woods. New waves of infection have slowed economic activity, and high-frequency economic data is signaling slowdowns in all major Western countries except for Japan. It is unclear how the markets will react to such a development.
A recent Goldman Sachs small business survey revealed that survivability is still a major problem. Only 60% of respondents are confident that their business will make it, which is a record low in the brief history of the survey.
The intermediate-term outlook is bullish, but I am inclined to wait for a pullback and a dissipation of overbought conditions before buying into the cyclical and value groups.


Futures lend support to continued upside.
Plan A. Trim into a significant gap up, and hope to reopen lower.
Plan B. Should markets instead open in the hole, I plan to add. My thinking right now as to how/what to add (subject to revision):
ryzax (Rydex value) and/or vtv (Vanguard value)
ryeax/ryeix (Rydex energy) and/or xle (I trimmed back on XLE last Friday – I would trim further on strength, or add back on weakness)
rybax/rybix (Rydex materials) and/or xlb
rycax/rycix (Rydex consumer products) and/or xlp
ryhrx (Rydex real estate) and/or vnq
ryhax/ryhix (Rydex healthcare)
rykax/rykix (Rydex banking) and/or ixj (global healthcare) My only exposure to banking right now is BAC.
ryfax/ryfix (Rydex financial services)
Small caps? Probably a good idea. I have existing positions in RYDHX, RYSPX, and VT.
Emerging markets? I’m already positioned in FXI and (unfortunately) BABA. I may try transitioning from BABA into EEM.
If we close at/near the highs on Monday, then I would probably opt to close most positions on Tuesday (basically, it’s been prudent to take ST gains on Day 3 of an upside move).
RX, may I suggest DREGX and JFAMX instead of EEM.
Thanks, Chuck. The two funds are probably not a good fit for me, as I often have short time frames and would be hit with either a ST redemption fee or front-end load.
Kicking off Plan A in the premarket session.
Trimming BAC/ XLE @ +2.87%/ +3.6%.
JETS off @ +6.7% relative to basis.
Scaling back into AYRO ~3.8x.
Adding to NIO @ 42.8x.
BABA – still in the dog house!
VT off ~88.
Transitioning from BAC to XLF.
Giving up on BABA and taking the hit. Might be a buy signal!
IMO, anyone chasing at these levels is likely to get burned in the short term.
I plan to close all remaining positions (RYDHX/ RYSPX) end of day.
Hulbert Sentiment Index @ 69%. Fear and Greed @ 71.
Not necessarily actionable sell signals, which I’ve done), but I wouldn’t want to be all-in right now.
Probably not the kind of headline you’d want to see right now:
https://www.marketwatch.com/story/fund-managers-are-believers-in-the-rotating-to-value-trade-latest-bank-of-america-survey-shows-11605618757?mod=mw_latestnews