Mid-week market update: Bloomberg reported that BAML strategist Michael Harnett wrote a report back on December 12 forecasting a melt-up. He believed the market’s gains would be front loaded in 2020. and he projected an S&P 500 target of 3,333 by March 3. The index reached that level intra-day today, and it’s still January. Are the front-loaded gains over?
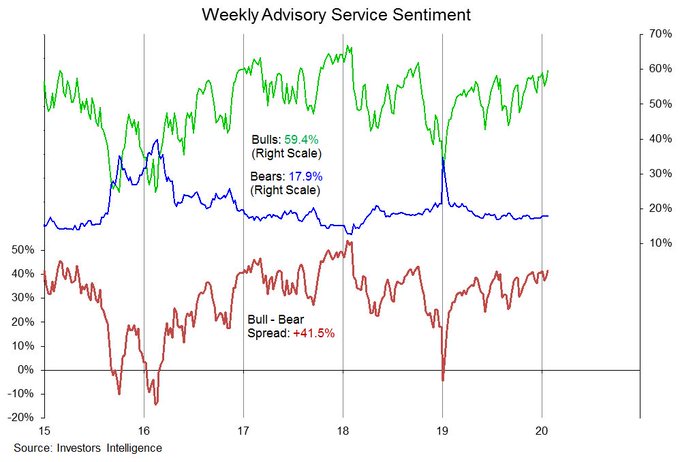
Sentiment is certainly extended. II %bulls rose to 59.4% this week, and the bull-bear spread has reached the highest level since October 2018.
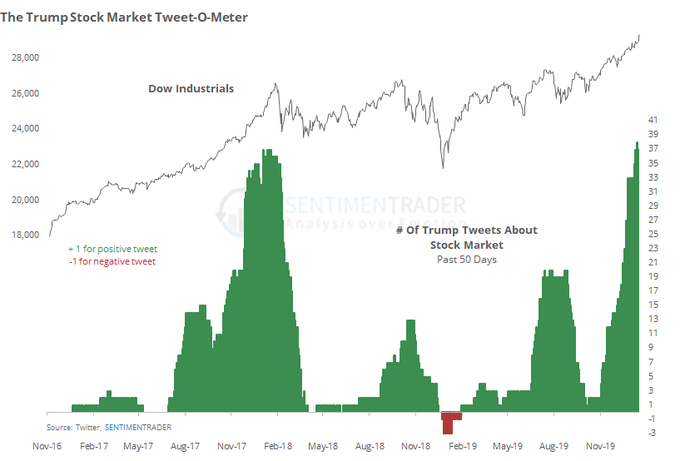
SentimenTrader observed that Trump’s tweets about the stock market had reached a new record.
As well, Macro Charts pointed out that further analysis from SentimenTrader showed that option buy-to-open volume reached a record high for a second week in a row.
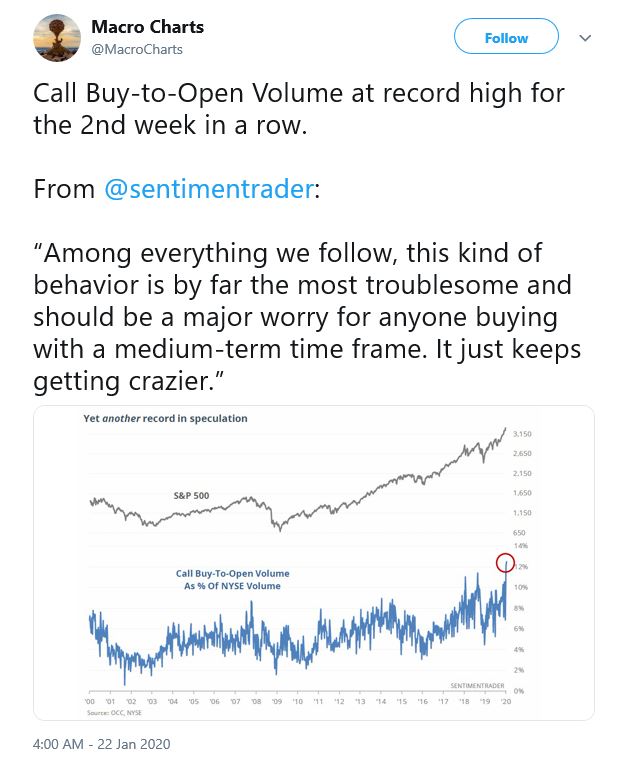
It certainly seems that the stock market is “cruisin’ for a bruisin'”.
Stage set for a volatility spike
I have been warning about the possibility of a pullback for nearly two weeks (see Priced for perfection). It isn’t just that the market is overbought and valuations stretched, fast money positioning is set up for a sharp response should any unexpected fears, such as a coronavirus induced economic slowdown, spook the market.
A week ago, Macro Charts reported that the market had gone 66 days without a 1% decline. The clock is still counting as both implied and realized volatility have compressed.

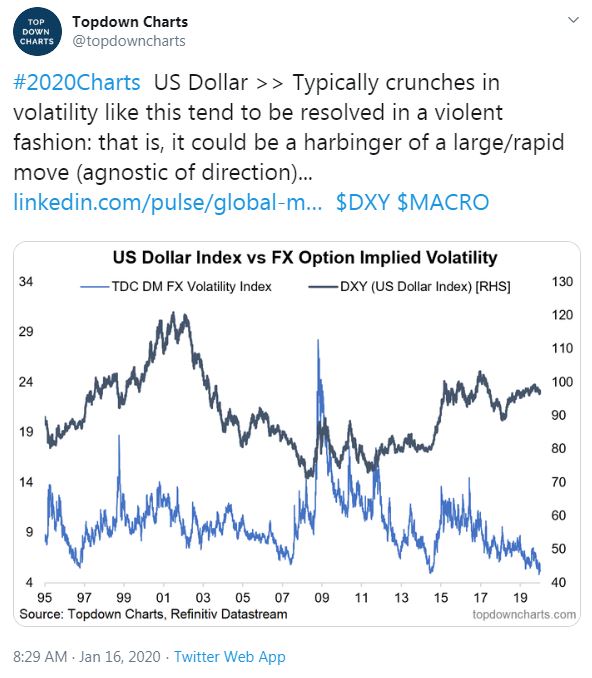
Callum Thomas at Topdown Charts also documented the case of suppressed FX volatility.
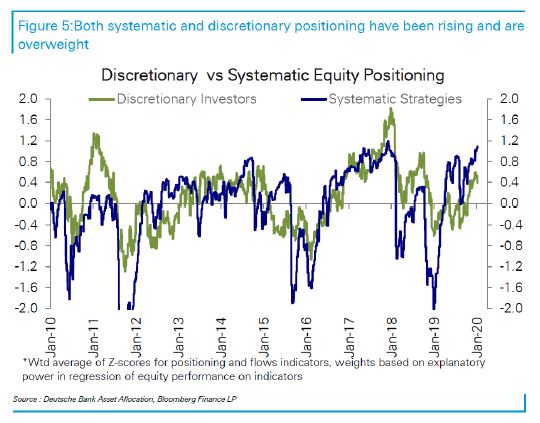
As overall asset volatility falls, the volatility, or risk, estimates that go into Value At Risk (VaR) models for trading desks also falls. This encourages traders to take more risk. Indeed, as volatility declined and the prices of risky assets rose, both systematic and discretionary hedge funds have piled into equities.
Moreover, they have also increased leverage in accordance to the reduce risk estimates from their VaR models.

We all know what happens next. Should volatility normalize, the level of risk and leverage allowable by VaR models declines. If such an event is accompanied by a risk-off episode, the potential for a disorderly sell-off is high. Credit Suisse documented what happened to the EURUSD exchange rate after past periods of suppressed FX volatility.

All the market needs is a trigger.
A coronavirus trigger?
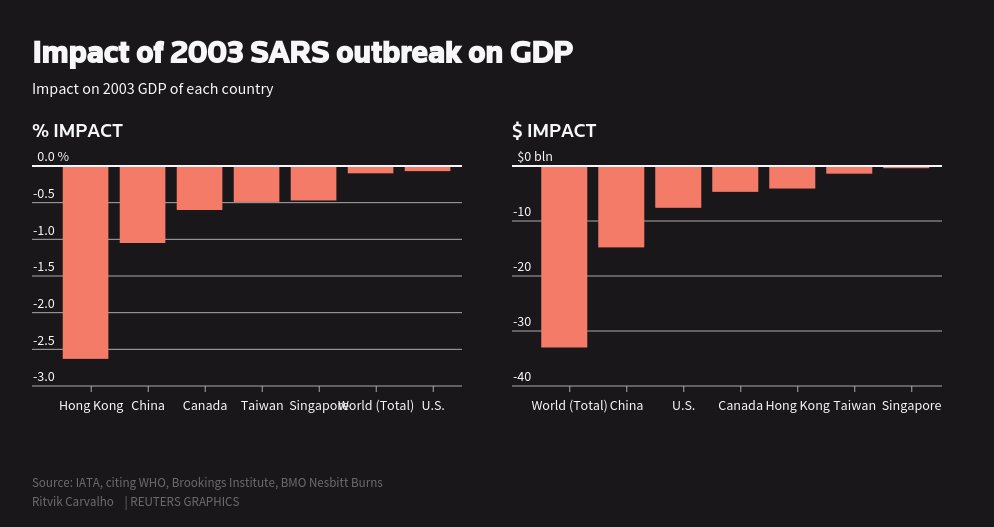
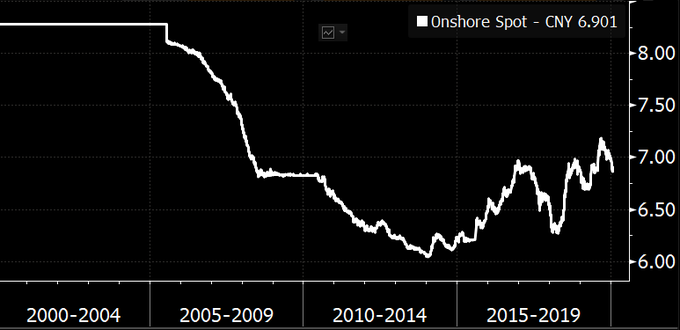
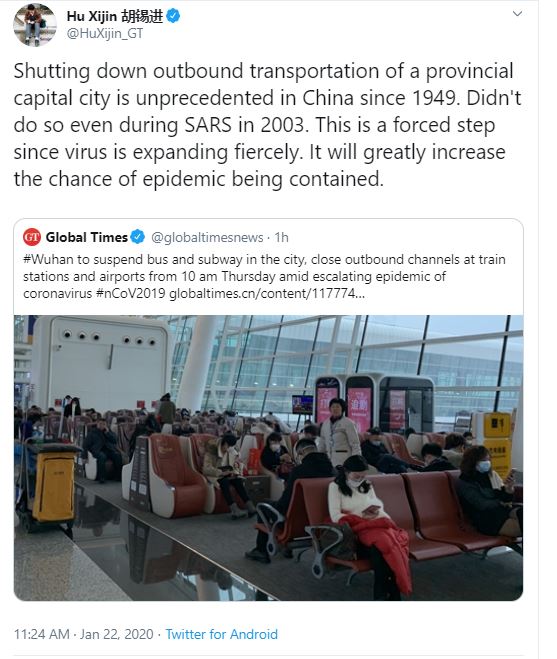
Could the coronavirus news be the trigger, or the excuse, for a volatility spike? As a reminder, the SARS coronavirus infection of 2003 infected thousands, and killed hundred. It also cratered the Hong Kong economy, and sliced 1% off China’s GDP growth,
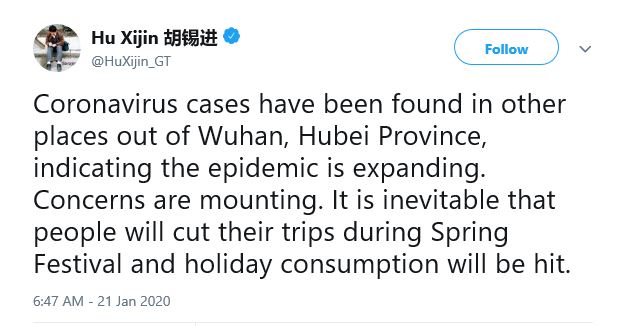
It is revealing that the editor of Global Times, which is part of the Chinese official media, would admit to the spread of the virus. The timing of the outbreak is unfortunate, as widespread travel during the Lunar New Year festivities is likely to encourage the spread of the infection.
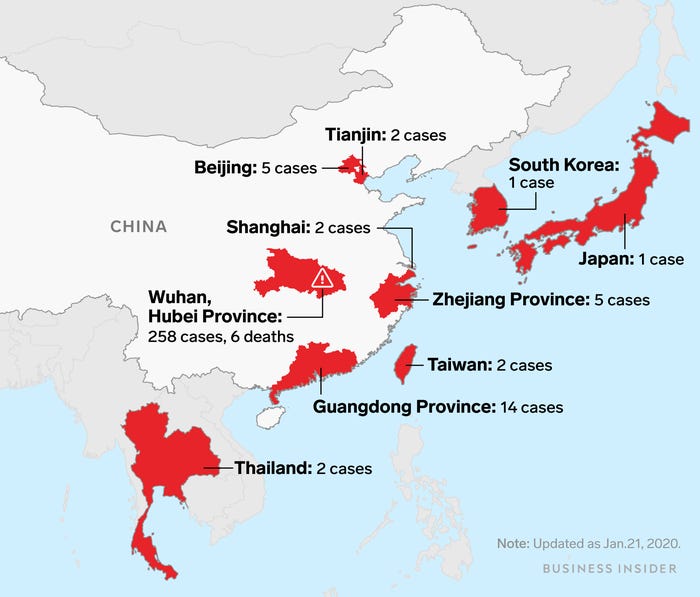
Business Insider reported the scope of the infection is widening quickly, and nine fatalities have been confirmed so far. The virus has migrated to the US. The Center for Disease Control announced its first case of infection yesterday.
Equally worrisome is the news that Wang Guangfa, a respiratory expert of Peking University First Hospital, has been infected with the virus (story in Chinese here). He is reported to be in stable condition.
Bloomberg Asia Chief Economist Tom Orlik pointed out two sources of fragility that Chinese economy faces today as a result of the coronavirus infection. First, services suffered the most during the SARS epidemic. Services comprise a far larger part of the Chinese economy today, which makes it more sensitive to consumption shocks.

As well, the financial markets were far more orderly then subject to more government control. Today, the markets play a bigger role in the price discovery mechanism. Consequently, volatility risk is far higher today compared to 2003.
To be sure, the current outbreak is less virulent than SARS. The apparent infection rate is far lower than SARS, and the Chinese authorities have been more proactive in dealing with the problem compared to the 2003 episode.
On the other hand, even the Ebola outbreak of 2014, whose economic effects were regionally isolated, panicked the market and spiked the VIX Index from 11 to 31 in the space of about a month (see The Ebola correction? OH PUH-LEEZ!).
Trade war trigger?
If the coronavirus is not enough to rattle the markets, another bearish trigger might be the threat of a transatlantic trade war. The fur is flying in a trade spat at Davos. In an unplanned news conference, Trump characterized the EU as “worse than China” on trade. The dispute over the French tax on digital companies remains unresolved, and Trump has threatened to impose tariffs on European cars in retaliation. The UK managed to get into the act, too. The Chancellor of the Exchequer Sajid Javid vowed to impose their own digital tax in April.

Stayed tuned.
Bracing for volatility
Another source of volatility might be the Iowa caucus. The WSJ reported that implied volatility usually picks up around elections, and traders are buying volatility ahead of the Iowa caucus.
Options markets are bracing for big swings in stock prices around the U.S. presidential election.
Traders are picking up options that would pay out after the Iowa Democratic caucuses on Feb. 3, betting on volatility, according to Wells Fargo Securities. That’s based on options tied to the S&P 500 expiring on Feb. 5. Traders have also paid up for options on the Cboe Volatility Index, or VIX, expiring that month, which would profit if market turbulence jumped through February.
Ahead of the Iowa caucus on February 3, another source of volatility might occur the week before. The FOMC meeting is scheduled for Wednesday, January 29.
Technical warnings
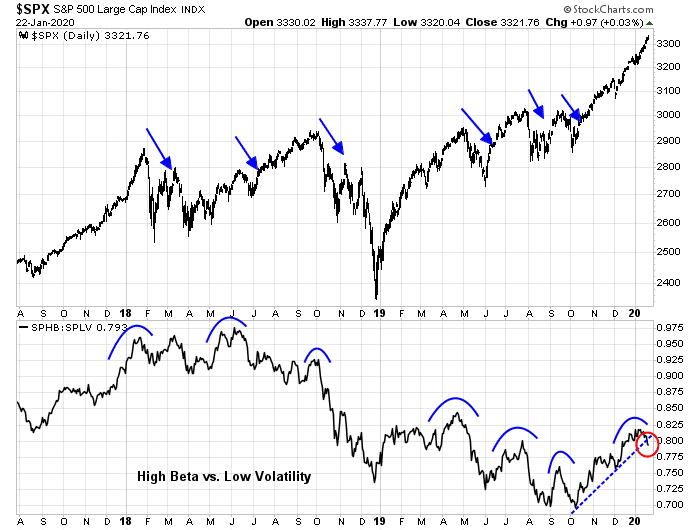
From a technical perspective, I have been monitoring the high beta/low volatility factor pair (see Froth everywhere!). In the past, rollovers in this pair trade has led market declines. It just breached a rising relative trend line to confirm a shift in regime from risk-on to risk-off.
Equally worrisome is the behavior of the DJ Transportation Average. Even as the DJIA made new all-time highs, the Transports has been stubbornly weak, and it has been unable to rally to fresh highs as confirmation.

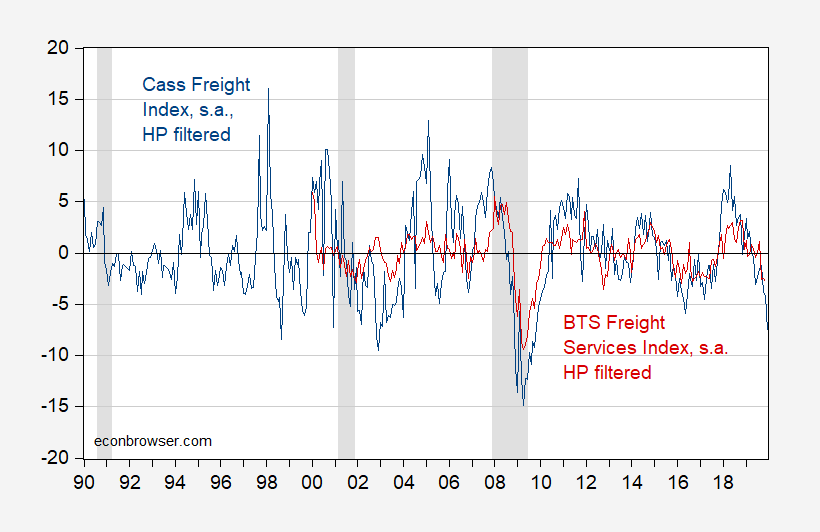
Econbrowser confirmed the softness of sector fundamentals by highlighting the weakness of the Cass Freight Index and BTS Freight Services Index.
My inner trader initiated a short position based on the rally of TLT, the long Treasury bond ETF, through a declining trend line. As rising Treasury prices tend to be risk-off signals, a bond market rally is bearish news for risk appetite. TLT fell below the trend line, but recovered Tuesday and strengthened Wednesday.

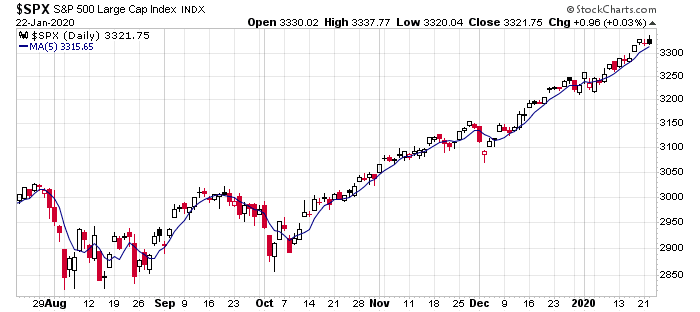
Having taken a partial short position, my inner trader is now waiting for the S&P 500 to decline through its 5 day moving average, as an additional bearish signal to increase his short position.
My inner trader is bearishly positioned. My inner investor remains bullish. While valuations are stretched, the longer term macro outlook remains bright, and downside risk is probably no more than 10%. If an investor is afraid of a 10% pullback, than he should re-think his commitment to equities.
Disclosure: Long SPXU