Preface: Explaining our market timing models
We maintain several market timing models, each with differing time horizons. The “Ultimate Market Timing Model” is a long-term market timing model based on the research outlined in our post, Building the ultimate market timing model. This model tends to generate only a handful of signals each decade.
The Trend Model is an asset allocation model which applies trend following principles based on the inputs of global stock and commodity price. This model has a shorter time horizon and tends to turn over about 4-6 times a year. In essence, it seeks to answer the question, “Is the trend in the global economy expansion (bullish) or contraction (bearish)?”

My inner trader uses the trading component of the Trend Model to look for changes in the direction of the main Trend Model signal. A bullish Trend Model signal that gets less bullish is a trading “sell” signal. Conversely, a bearish Trend Model signal that gets less bearish is a trading “buy” signal. The history of actual out-of-sample (not backtested) signals of the trading model are shown by the arrows in the chart below. The turnover rate of the trading model is high, and it has varied between 150% to 200% per month.
Subscribers receive real-time alerts of model changes, and a hypothetical trading record of the those email alerts are updated weekly here.
The latest signals of each model are as follows:
- Ultimate market timing model: Buy equities
- Trend Model signal: Neutral
- Trading model: Bullish
Update schedule: I generally update model readings on my site on weekends and tweet mid-week observations at @humblestudent. Subscribers receive real-time alerts of trading model changes, and a hypothetical trading record of the those email alerts is shown here.
The Last Hurrah rally continues
I apologize for the relatively brief update as I am writing this on an unsteady internet connection. The “last hurrah” scenario that I recently outlined (see How the equity bulls and bears may both be right) is playing out more or less as expected.
The 4.1% Q2 GDP report is keeping the Fed on track for two more rate hikes this year. At the current pace of rate hikes, my long leading indicators will flash a recessionary warning late this year, indicating a slowdown in late 2019. Since stock prices tend to look ahead about a year in advance, that puts the the timing of an equity market top in Q4 2018. However, the timing of a recession, and a market top, could get pulled forward should a full trade war erupt.
In the short run, coincident and short leading indicators are strongly bullish. These conditions suggest that stock prices will make a “last hurrah” rally. Here are my trading bull/bear tripwires. The S&P 500 has formed a bullish cup and handle breakout with an upside target in the 2925-2960 range. Stay bullish if the index holds above its breakout level of 2795-2800.

Bearish tripwires
Notwithstanding the Facebook and Intel debacles last week, earnings season results are coming in solidly. Stay bullish as long as earnings reports appear bullish, and estimate revisions rise, which indicate positive fundamental momentum.
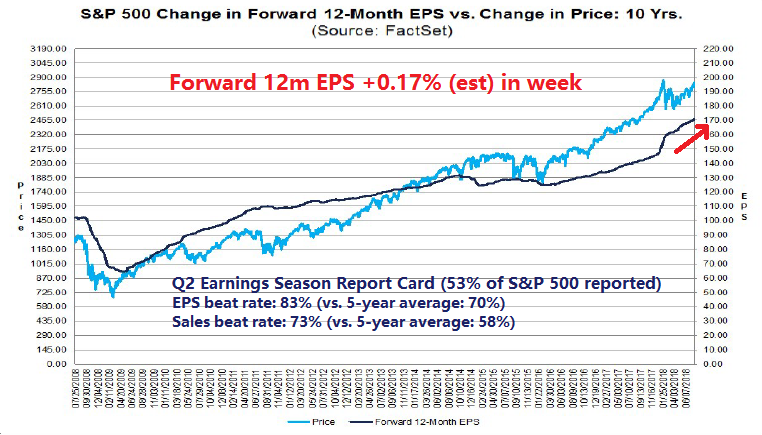
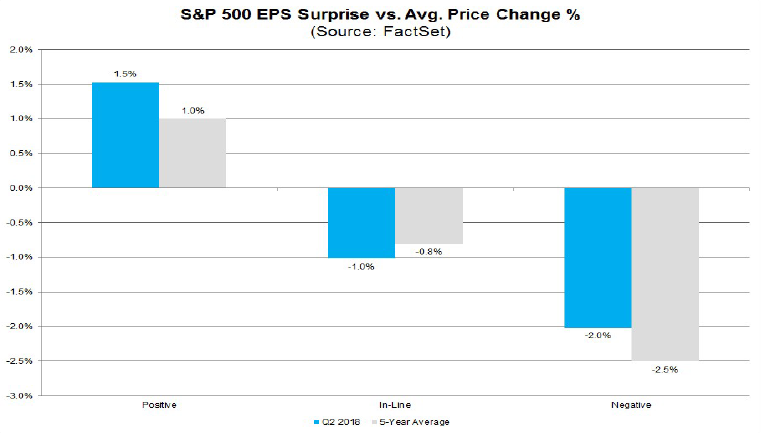
Stay bullish as long as the market is rewarding earnings beats and punishing misses in a fashion consistent with the historical experience.
At a minimum, stay bullish until the Fear and Greed Index reaches the target zone. We are getting close, but not yet.

Credit market risk appetite has also been recovering across the board, which is supportive of higher stock prices. The duration-adjusted price ratio of high yield (junk) bonds to Treasuries hit an all-time high last week. Stay bullish until these ratios decisively turn south.

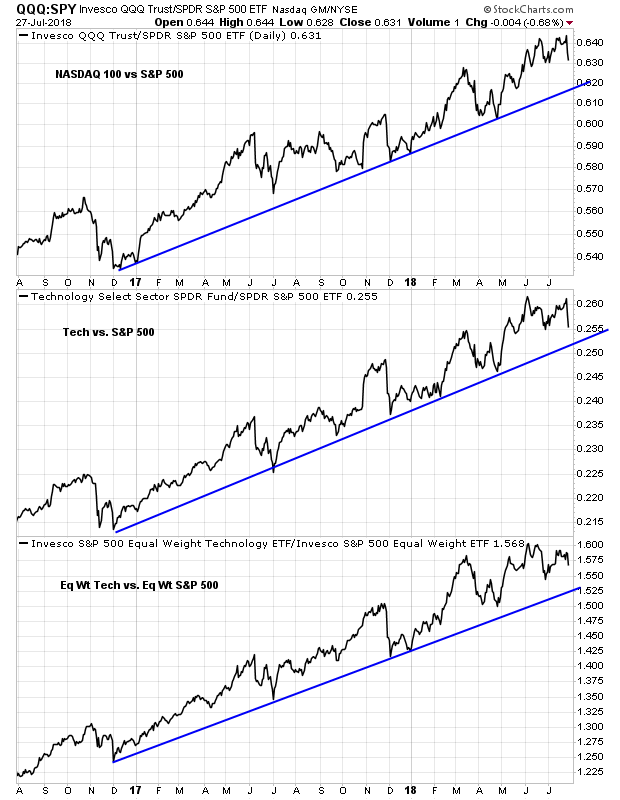
From a longer term context, the correction in technology related names can only be described as a hiccup. Stay bullish unless these relative trend lines are broken.
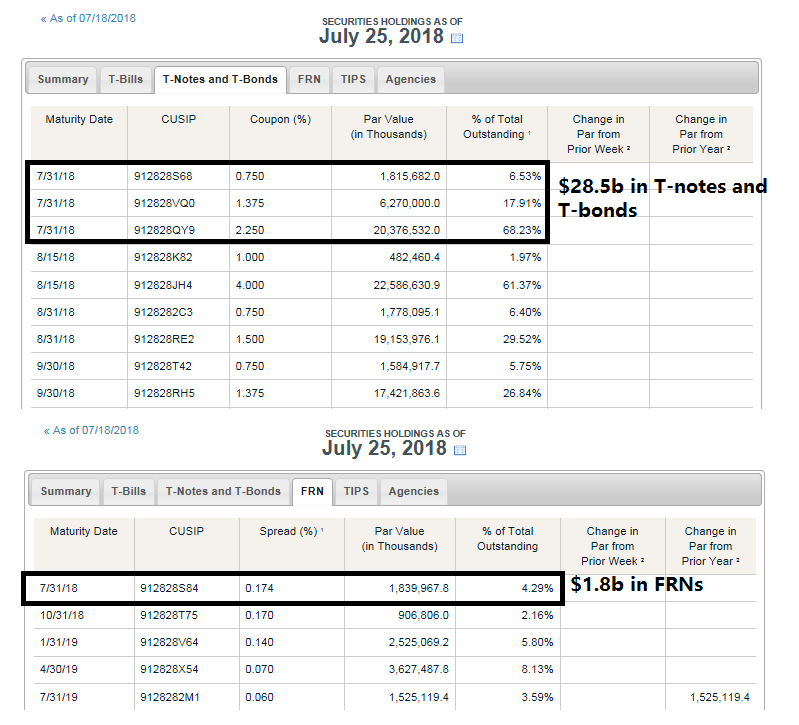
From a very short-term trading perspective, be aware that the next QT day is July 31, 2018, when the Fed will see $32b in Treasury securities mature and roll off its balance sheet (via the New York Fed). The stock market has hit an air pocket on days that QT has occurred this year (see Offbeat Thursday and Friday forecasts).
My inner investor remains constructive on stock prices. My inner trader would be buying this dip if he wasn’t away from his desk, and he could monitor the market action more closely.
I will try to post any updates during the week but cannot guarantee anything due to the spottiness of my internet connection. Regular service will resume next weekend.
Disclosure: Long SPXL
Have a great trip Cam. You deserve it. Don’t get eaten by lions.
Whenever I comment, it’s always about intermediate term projected price action not short term. Sometimes we get so involved in the short term action that we miss the bigger picture which occasionally sideswipes us and takes back the short term gains we’ve made.
My personal narrative is that I’ve missed, for my clients, every bear market since the mid-1980’s after being devastated by a crash early in my career. Sounds impossible but here is a link to a national newspaper article that talked about the party my clients and I had in December 2008 at the bottom, celebrating missing the Crash.
https://kenmacneal.ca/photos/custom/ROBdec08-globe-and-mail.pdf
I’ve done this by accumulating a toolkit of indicators that flash warnings signs when the longer term cycle is less safe than normal. These also indicate when things are safer than normal like early 2016 when everyone was worried about the seven year bull market ending due to old age. I was maximum bullish and said in this blog that we were birthing a brand new multi-year bull market (which has happened) because my three areas of indicators were all green, VALUE (10 year treasuries then at 1.4% and market dividend yield at 2.3% equals CHEAP), Investor Sentiment (very nervous about seven year market peaking) and Economic Outlook (no general recession on the horizon and the energy sector depression turning around).
Where are we today? Value is Expensive (10 year treasury now up at 3% with dividend yield down at less than 2%). Sentiment is Optimistic (down from Bubbly in January but still high). The Economic Outlook is cloudy with current stats good due to the one shot tax cut benefit but the forecast (which the stock markets trades on) sees Fed tightening clearly causing a recession with only the timing in doubt and a trade war possibly toppling the international business world dominoes at any moment.
In early 2016, these three indicator areas were Plus-Plus-Plus. Today they’re Negative, Negative, Negative. (BTW I look at many indicators in each of these three areas not just the ones mentioned above.)
I turned negative in early 2008 with various avoidance techniques that still allowed my clients to be up about 8% for the year. This was early since the markets traded in a high range until the spring. Tops can be a longer term process as Cam has mentioned often.
Let me leave you with a thought about why the next bear market might be surprisingly nasty and sooner than we expect.
Here is a recent article about margin debt. I read this every month watching the zigs and zags on a short term basis versus the short term movements of the general markets.
https://www.advisorperspectives.com/dshort/updates/2018/07/27/margin-debt-and-the-market?&bt_ee=ju7uzr6EhkOvLxVub4432XdBPFHmH/oKltTlaa2tcL1t68lBJNqTrpZmw+43jiRP&bt_ts=1532775094980
That’s one, very long URL but if it doesn’t work for you, go to the Doug Short blog to find it. Or you can email me at info@kenmacneal.ca and I’ll send it as a PDF.
Yesterday when I was looking at the chart I stepped back and look at what’s been happening since 2009 with the long bull market combined with microscopic interest rates. Until then, I’d just been watching month by month, short term activity. Wow, total NYSE margin debt had ballooned to over 300 billion dollars. A third of a trillion bucks!!! My understanding is that banks have also loaned huge amounts for stock purchases above this. Double WOW!
In 2007, the bubble was in sub-prime loans for real estate that caused a crashing stock market. This time it’s closer to home, margin loans.
Notice on the charts that at the bottom of a bear market that margin accounts end up with a net overall positive credit balance when the margin folks have capitulated after a bear market has crushed their spirits and their new worth. In other words, all the loans have been paid off with stock sales. Hmmm. A lot of stock.
How many of these folks had Facebook, Twitter or Intel that recently got crushed overnight. There is a chill developing in this best-performing technology sector where I’d guess a lot of hot money, margin players are playing.
Maybe people on margin that get bumped and bruised a few times decide to take a margin holiday and pay off their loans by selling stocks. Maybe that keeps a lid on the market and/or exacerbates a decline when one starts. The picture that struck me when I stepped back, is that this is one huge amount stock to sell.
The Fed promoted this type of borrowing, even announcing they wanted Their QE program to boost the stock market to have the wealth effect of higher markets aid the general economy. They had NEVER before linked their moves to the stock market. This reminds me of the congressional moves to force U.S. banks to lend sub-prime money to allow unqualified borrowers to buy homes and extra real estate before the GFC. Now we have Fed QT reversing the stimulus. This time, they aren’t going to announce that this will send the stock market down and give a reverse wealth effect to hurt the economy. We investors have to figure that out for ourselves. The stock margin players may end up like the sub-prime home buyers.
One last thought, early in my bear market avoidance career, I used moving average trendlines to exit and repurchase. These strategies worked to outperform over time but they were frustrating to use since they are unnecessary and costly early in a bull market even though they are very necessary and profitable when the market flips from bull to bear for a short time. As part of my 2008 success, I had progressed to only using moving average exiting techniques when my Value/Sentiment/Economy indicators were all negative. That was amazingly successful in 2008. That means you only use this time tested strategy when it’s needed and profitable.
I’ll let you guess if you think I’m now going to start using moving averages to protect my clients gains.
Margin loan data is deceptive. Securities backed loans are not counted as margin debt. Unfortunately we have no publicly available data source for that kind of debt so we have no idea of what the real story is.
https://www.wsj.com/articles/wall-street-needs-you-to-borrow-against-your-stock-1501147801
What Cam is saying is the bank margin loan balances are unreliable since they aren’t reported separately but the NYSE Margin loans in the article link above are real totals officially reported every month by brokerage firms.
Chill Cam, have a good vacation!!!
To soon to discuss position changes for the expected recession?
F
Ken, Cam
Thanks for sharing your insights. I suppose, one could push the envelope and stay in the market till the final blow out top of the current bull market, but, at increasing risk.
On the other hand, as Ken is pointing out, one could batten the hatches right here, right now, within say 10-20% of a major market top and patiently wait for a bear market to develop. One would do well if one were to invest cash reserves, within 10-20% of a bottom and liquidate within 10-20% of a top. This sounds simplistic, but Cam has been trying to teach how to spot these turning points.
It really depends on ones risk tolerance and time horizon. A person within ten years to retirement at present, may want to reduce exposure, right here, however a person reading this, in their 30s who has several decades to retire, may do nothing, but wait patiently, and deploy cash reserves in the next couple of years, for a very long term horizon.
Exactly. Well said.
Ok, this brings up a few other questions, How much do you liquidate? What do money managers like Ken do, go 20% Cash, or 50% Cash? I am a long term investor with at least another 30 years to invest, Do you usually recommend for someone like me to go 50% in cash when you see a bear approaching?
I know well, THIS IS WEBSITE IS NOT A RECOMMENDATION SITE, (insert CAM’s usual boiler plate here), however for a clearer picture as to what people like KEN would do when liquidating, part or go all cash.
Full disclouser: I have been 20% in Cash since after Feb, as per Cam’s prediction then. So, as someone who wants to learn how to fish, how much do you liquidate? I ask this question, knowing well that, Everyone’s risk tolerance levels are different. But like Ken says, We are all in this together… =) Thanks in advance for your response, I look forward to reading it.
Best to have a personal min/max range where you have max when markets are intermediate term safer than normal (stocks cheap/investors pessimistic/leading economic indicators good) and min when markets are more risky than normal (stocks expensive/investors optimistic/leading economic indicators poor).
I have two model portfolios Growth and Balanced. Growth has a 50%-100% range in equities at extremes. Balanced for retired folks is minimum 30%, max 70%.
I’m now at min weighting because Value = Expensive, Investor Sentiment is Optimistic and the Economic Outlook is negative with the Fed tightening/inflation rising/trade war.
The name for this strategy is tactical asset allocation. It adjusts one’s portfolio by looking at what’s happening rather than having fixed percentage holding of stocks and fixed income.
BTW when I say fixed income, I don’t really look at the non-stock part of the portfolio that way like I used to. With interest rates going up, possibly a long way, bonds could be a poor way to hold money outside stocks. I use alternative investments like long/short investments and other conservative things that can weather a rising interest rate world while I’m waiting to raise my equity portion back to maximum.
Hope that helps. Bottom line, it’s personal but have a range and adjust it on an intermediate basis depending how the big picture evolves.
Ken,
Thanks for clarifying a range. That’s exactly what I meant about percentages, i.e. what’s to do when anticipating a bear market. Or better yet, what do professionals do and how much do they liquidate? Your answer was perfect in helping me determine, based upon my risk profile of course, how much liquidation is good.
I really appreciate all your post over the years, and thank you again.
Mohit
Tweaking of portfolios IMHO is dependent on how far one is from being financially independent.
A person who is say thirty to forty years from retirement, has a long time to recover from a major bear market (50-60% loss). However, a person only 10 years from retirement will not have that kind of luxury.
A person whose net worth is say 20% of eventual accumulation and time on their side, say, 30-40 years to retirement may choose to do nothing at this time.
This is a time in history where precious metals have majorly underperformed all other asset classes, and may be good entry point into this class of asset. There is absolutely no interest in buying precious metals but that makes it a contrarian buy. We had similar opportunity in American real estate, circa year 2010-12. Cam called a generational bottom in oil about 1.5 years ago. Both were excellent opportunities to create large portfolios in these two assets. Precious metals (silver is worse than gold), are in a similar situation, having lost value against the $ over the last 7 years. A book that I found very interesting is by Meb Faber, titled Global asset allocation (free download from his website), talks about how portfolios perform with various asset allocation. Meb Faber analyses dozens of portfolios. Many of them have no more than 30% of net worth in stocks. Many have upto 20% in precious metals.
Be clear that Cam’s analysis is pointing to further gains in the markets, and he has not called a major market top here. Many venerable analysts are in the same position as Cam. Earnings yields on stocks (inverse of PE ratio) is still higher than 10 year bond yields. Barring short term volatility, stocks are seen cheaper than bonds, every now. Stay nimble, humble and diversified.