Preface: Explaining our market timing models
We maintain several market timing models, each with differing time horizons. The “Ultimate Market Timing Model” is a long-term market timing model based on the research outlined in our post, Building the ultimate market timing model. This model tends to generate only a handful of signals each decade.
The Trend Model is an asset allocation model which applies trend following principles based on the inputs of global stock and commodity price. This model has a shorter time horizon and tends to turn over about 4-6 times a year. In essence, it seeks to answer the question, “Is the trend in the global economy expansion (bullish) or contraction (bearish)?”
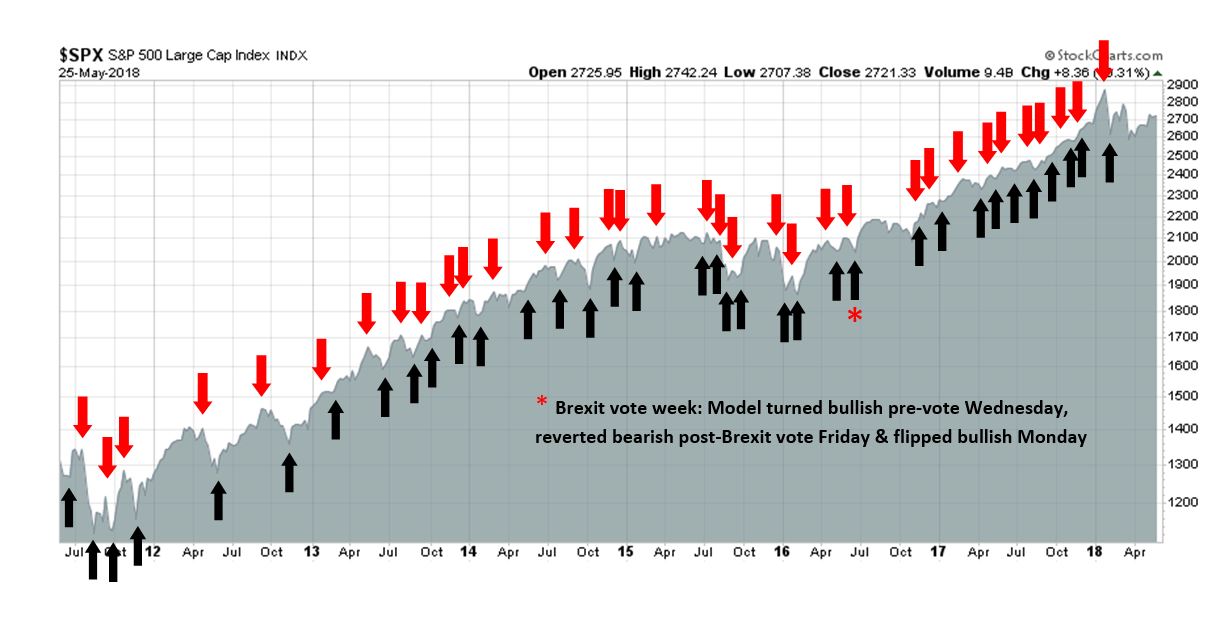
My inner trader uses the trading component of the Trend Model to look for changes in the direction of the main Trend Model signal. A bullish Trend Model signal that gets less bullish is a trading “sell” signal. Conversely, a bearish Trend Model signal that gets less bearish is a trading “buy” signal. The history of actual out-of-sample (not backtested) signals of the trading model are shown by the arrows in the chart below. The turnover rate of the trading model is high, and it has varied between 150% to 200% per month.
Subscribers receive real-time alerts of model changes, and a hypothetical trading record of the those email alerts are updated weekly here.
The latest signals of each model are as follows:
- Ultimate market timing model: Buy equities
- Trend Model signal: Bullish
- Trading model: Bullish
Update schedule: I generally update model readings on my site on weekends and tweet mid-week observations at @humblestudent. Subscribers receive real-time alerts of trading model changes, and a hypothetical trading record of the those email alerts is shown here.
Rising household stress
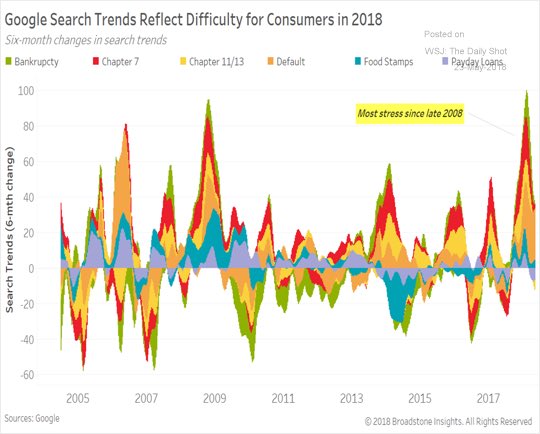
The headlines look dire. CNN proclaimed that “40% of Americans can’t cover a $400 emergency expense”, according to the Fed’s annual Report on the Economic Being of US Households. Further research from Google Trends showed that interest in consumer items is tanking.

In addition, searches for bankruptcy and financial reorganization spiked recently, indicating rising stress in the household sector.
Last Friday’s release of consumer sentiment missed expectations and readings are continue to deteriorate.

The economy is at or near full employment. Is this as good as it gets? Is this what prosperity looks like? What does this mean for policy makers?
For investors, the key question are:
- How stressed is the household sector; and
- Is this precursor to a bull market killing recession?
A household sector report card
To assess the financial status of the American household, let us first consider real retail sales, which is an important driver of economic growth. History shows population adjusted real retail sales has topped out before past recessions, and the latest data shows a possible plateau, but the jury is still out on that score. In the past, it takes about six months to confirm an actual peak in retail sales. The last peak occurred in November 2017, and the May 2018 data has not been reported yet.

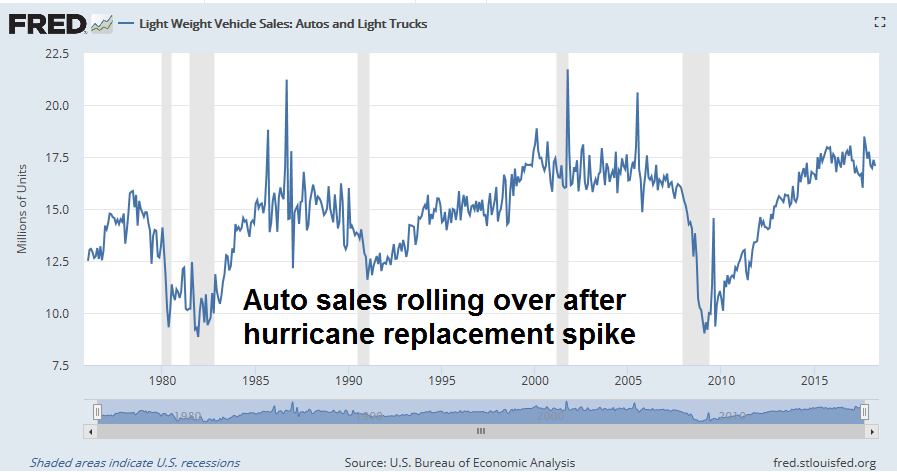
If consumer spending were to weaken, it would show up in the cyclically sensitive consumer durable sector. The report is also mixed. On one hand, auto sales appear to be rolling over after the most recent hurricane replacement spike.
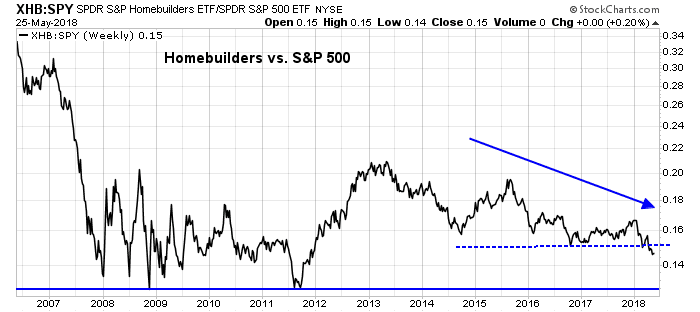
On the other hand, the housing sector appears to be still healthy. This cyclically sensitive sector has topped out ahead of past recessions, though it is enjoying a start of a demographic tailwind as millennials begin to enter the market and raise housing demand.
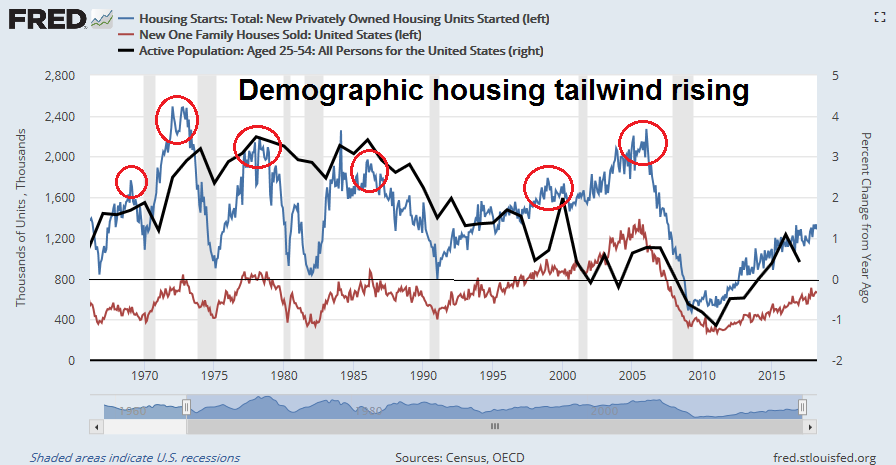
That said, the weak performance of the homebuilding stocks relative to the market has to be regarded as disappointing for the housing outlook.
Score retail sales and consumer durable sales growth as neutral. Real retail sales are trending up but may be plateauing, but the jury is still out. Auto sales are rolling over, but the housing sector remains strong, buoyed by positive demographics. The dire stories about a tanking consumer may be overblown.
The anatomy of consumer finances
Still, there is an element of truth that household finances are becoming more fragile. My analysis of consumer spending considers its underlying elements. It all begins with wage growth. While average hourly earnings have been rising steadily and annual growth now stands at 2.6%, the level of wage growth has been extraordinarily muted by historical standards. The unemployment rate is 3.9%, which was last seen in 2000, and before that, the 1960`s.
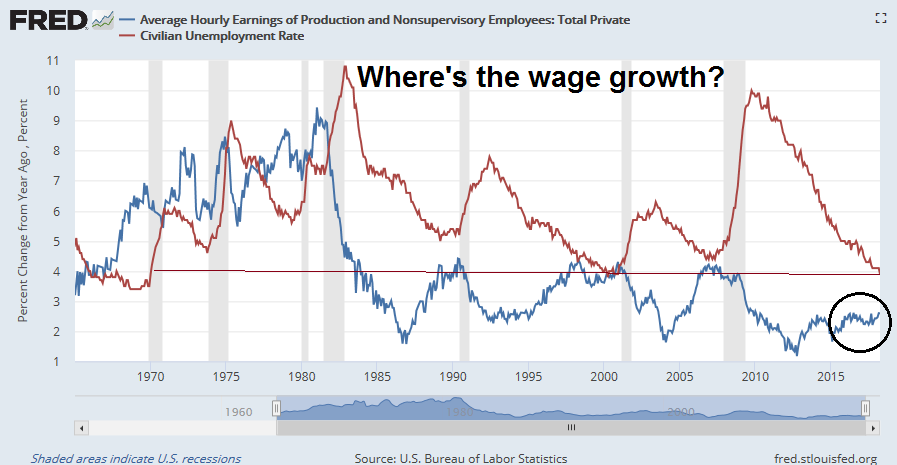
One of the puzzle that has bedeviled economists and policy makers is the lack of wage growth in the current tight labor market. A number of explanations have been advanced, such as demographics, where retiring well paid Baby Boomers are replaced by younger and less well paid Millennials. Another is the rise of an employer monosony holding down wages. The following chart from the San Francisco Fed shows “wage rigidity”, or the percentage of employees who have received no wage increases. Even with the unemployment rate at 3.9%, the current level of wage rigidity is higher than the peak seen in the last cycle.

Wage growth is the primary driver of consumer spending. As this chart from Political Calculations shows, median real household income has been flat since 2000.

Still, households have other ways of coping in the face of stagnant pay increases. The first avenue of coping is to spend more by saving less.

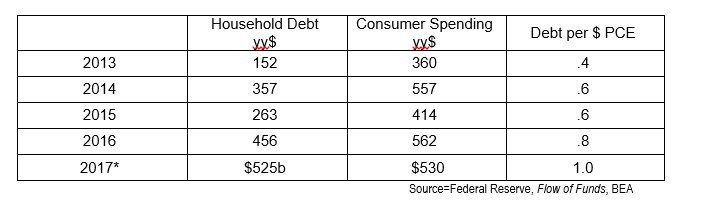
After drawing down savings, consumers could borrow to finance spending. The Fed’s flow of funds data shows that households are funding virtually all of their marginal expenditures with debt, up from 40% in 2013.
Rising debt raises financial risk for households. An analysis of the credit card delinquencies shows that as interest rates rise, delinquencies are likely to rise to recessionary levels by next year.

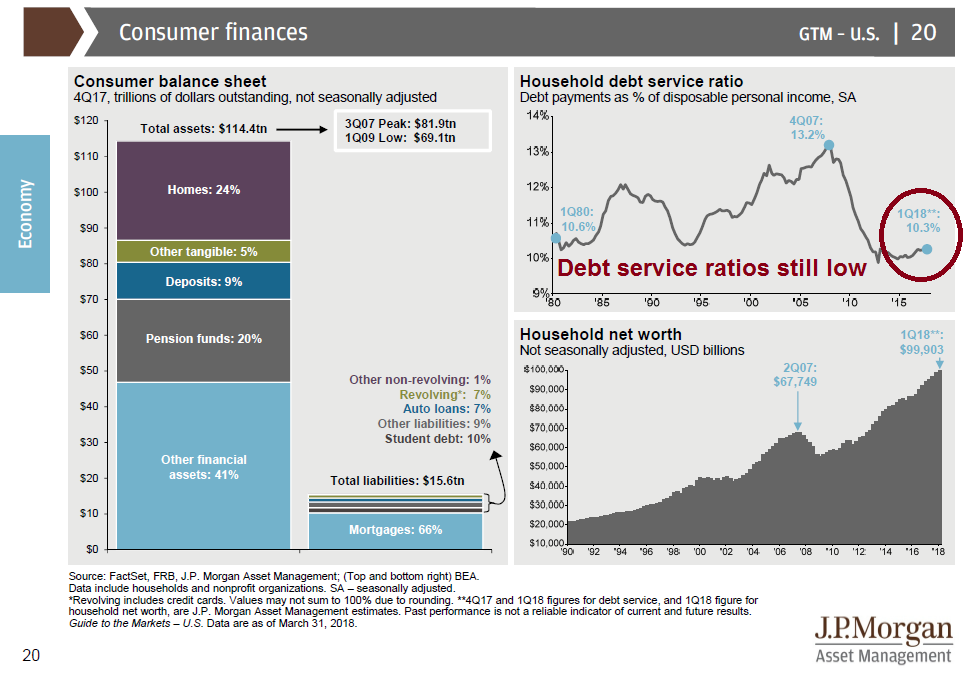
Despite the dire picture, household finances are not that dire as they seem. The latest update from JPM Asset Management shows that household debt ratios are still low, and their balance sheets are in good shape (annotations are mine). In other words, they have plenty of room to borrow if they want to.
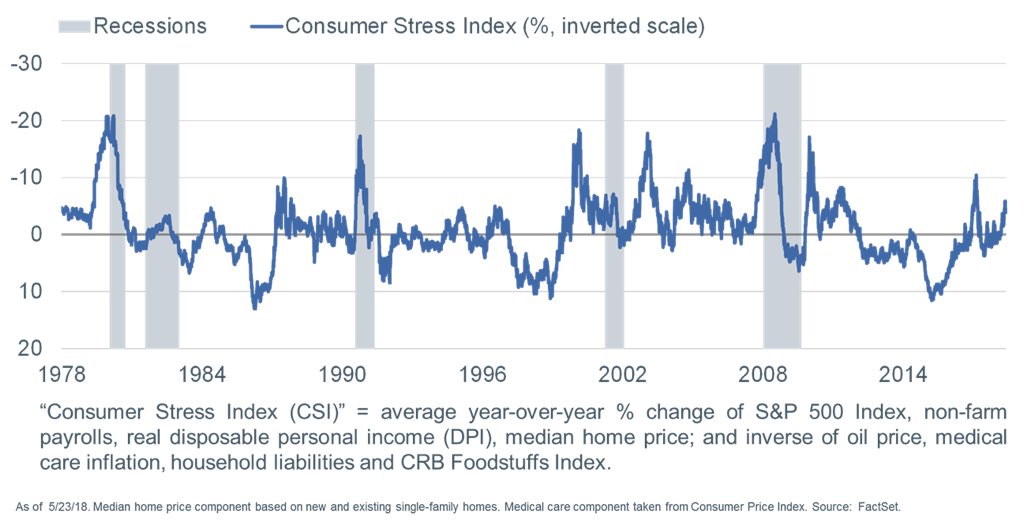
Liz Ann Sonders at Charles Schwab has created a Consumer Stress Index to measure the state of household finances. The latest readings indicate that consumer stress is rising, but readings are not in the danger zone yet.
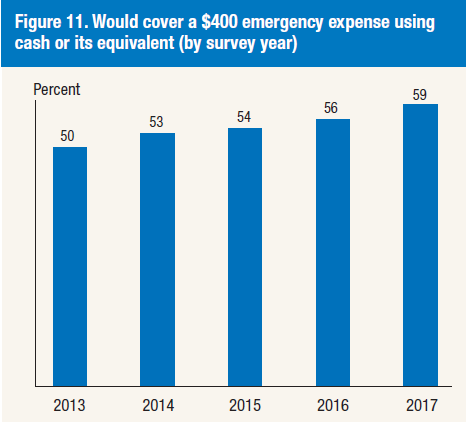
Oh, and the headline about 40% of American households who can`t cover a $400 emergency expense? While the absolute level is still worrisome, the same Fed survey shows that the trend has been steadily improving.
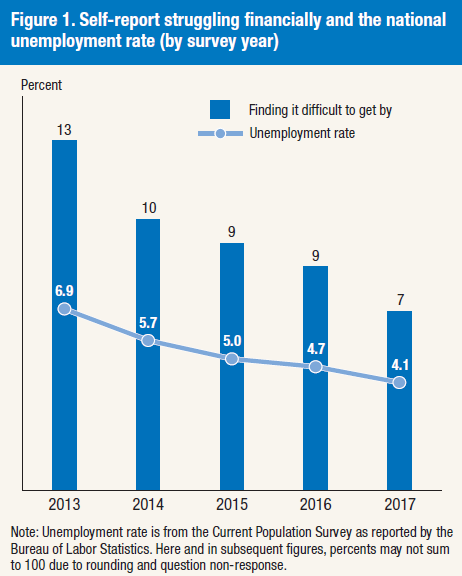
Moreover, the percentage of survey respondents who report that they are “finding it difficult to get by” has been falling as well.
A growing financial divide
Does this mean the ominous headlines about deteriorating consumer finances are overblown and it’s time to sound the all clear? Not so fast!
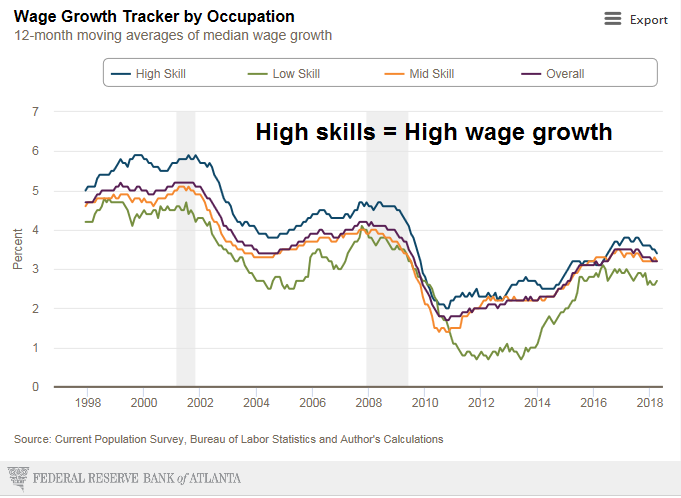
Detailed analysis an picture of bifurcated consumer finances and rising household fragility that will haunt the economy in the next downturn. The Atlanta Fed’s wage growth tracker captured this effect. People with high skill sets consistently enjoyed higher wage growth compared to the rest of the population. Remember your math, a consistently higher wage growth will lead to an acceleration in wealth differences over a lifetime.
While the relationship is less clear, skill sets can be proxied by education levels.

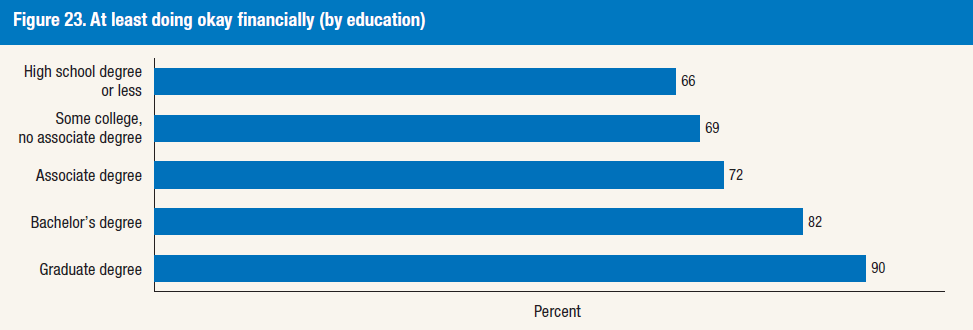
The Fed’s annual Report on the Economic Being of US Households tells a similar story of a financial divide is by education. Survey respondents were asked if they were “doing okay financially” and results increased steadily as education levels rose.
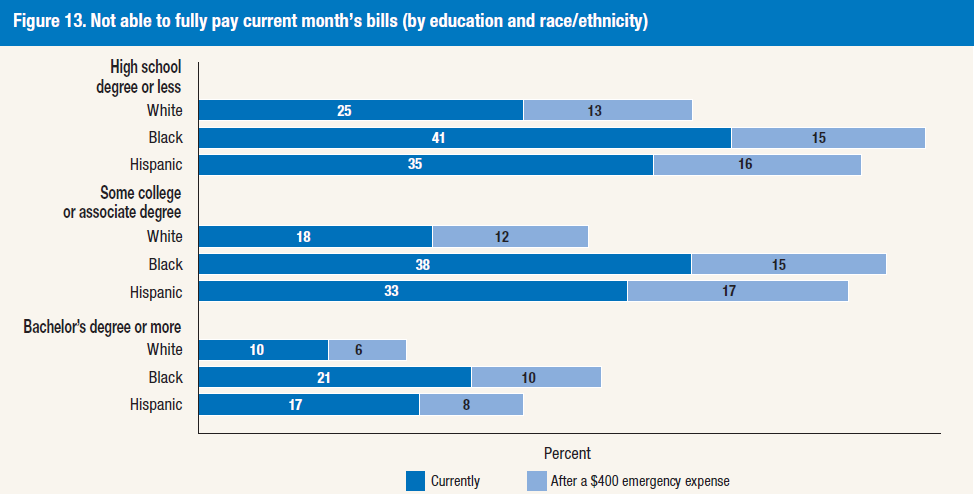
The flip side of the coin shows the respondents who were unable to fully pay the current month’s bills. We can observe a marked deterioration by education, and within each educational grouping, by race.
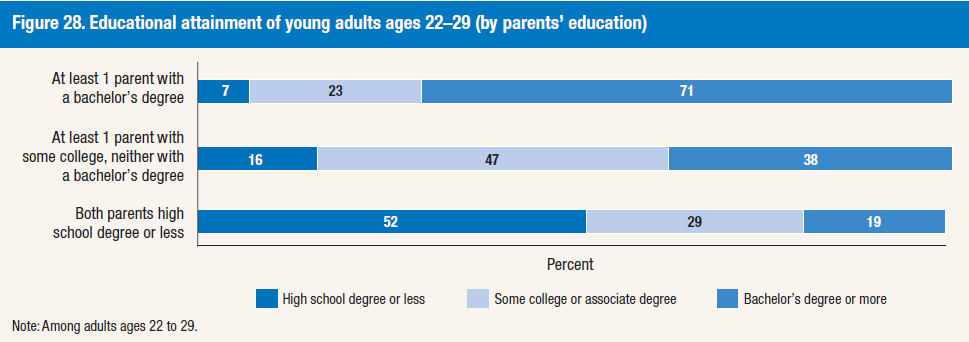
What about the American Dream and the idea of America as the land of opportunity? If education is the great equalizer, then the future looks problematical. Survey results show that parental educational attainment affect their children’s education levels.
In conclusion, aggregate statistics of household finances indicate that while consumer stress is rising, they do not constitute a danger signal of looming recessionary conditions. However, aggregates don’t tell the entire story, and further detailed analysis shows a bifurcation of household finances that will exacerbate the magnitude of the next downturn, and create longer term political problems in the United States.
The week ahead
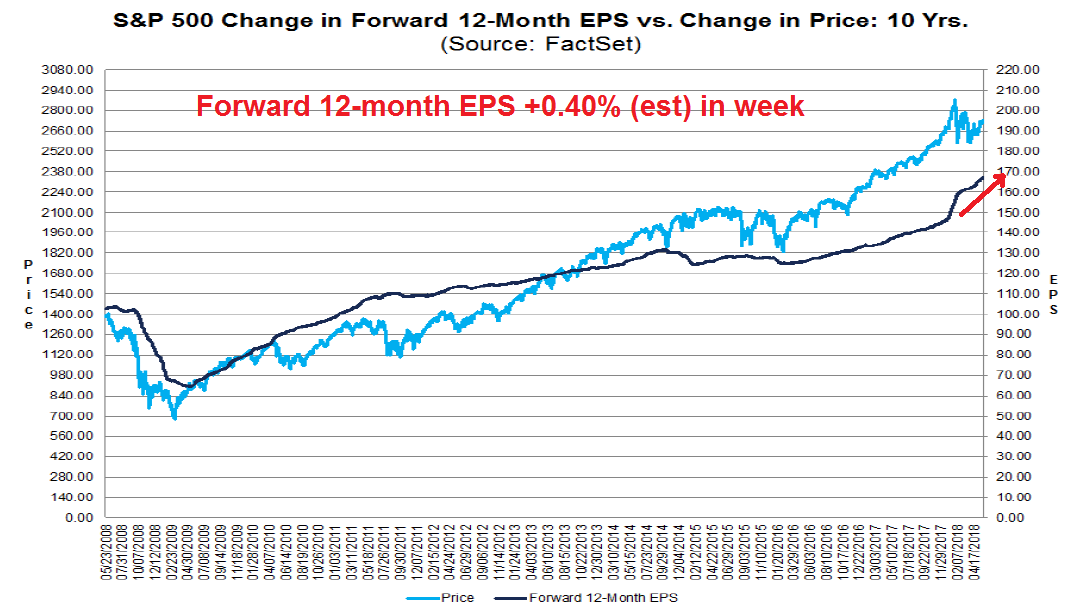
Looking to the week ahead, positive macro momentum is holding up this market. The latest update from FactSet shows that forward 12-month EPS continues to surge upward.
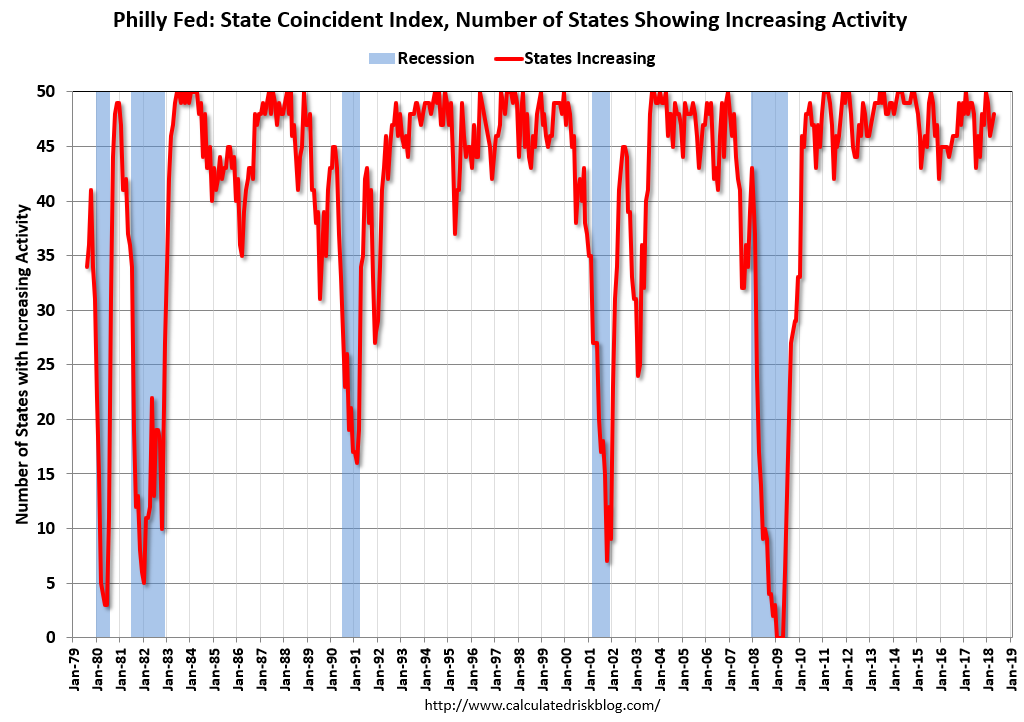
Other nowcast indicators are flashing bullish readings. The Philly Fed coincident state indices rose in 45 states, and the three month diffusion index was up in 49 states out of 50 (via Calculated Risk). Other elements of the Philly Fed indices are also upbeat (see Bear markets simply don’t start this way).
From an intermediate term technical perspective, the outlook is bullish. This chart from OpenInsider shows that insider selling usually exceeds insider buying and rarely do the two lines cross. In the last two instances where the two lines have intersected, downside equity risk was minimal.
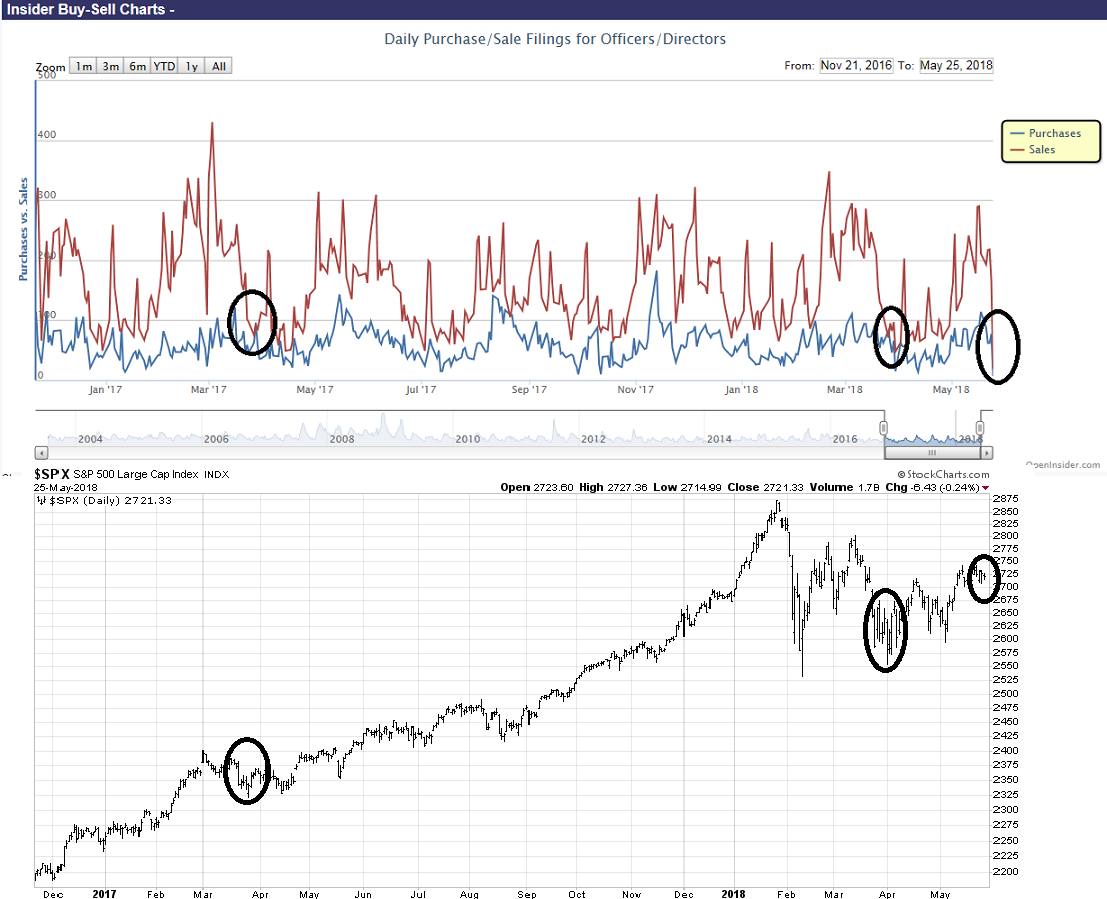
The OpenInsider buy signal was confirmed by the weekly summary of insider activity from Barron`s.
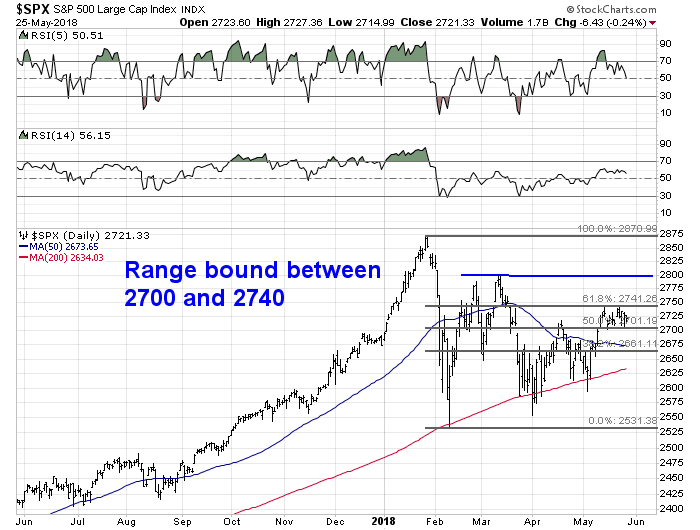
Shorter term, the SPX remains in a short-term no-man’s land between Fibonacci retracement levels of 2700 and 2740, with further resistance at 2800. Until either the bulls or bears can demonstrate sufficient resolve to break either of these levels, my inner trader is leaning slightly bullish but he is playing a waiting game.
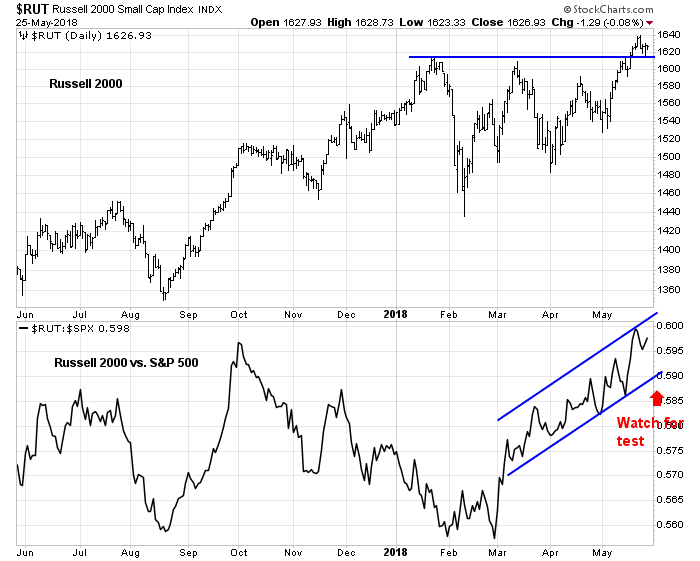
Small cap stocks, as measured by the Russell 2000, remains the market leaders as they staged upside breakouts to fresh highs and the index has held above the breakout level. However, the relative performance chart (bottom panel) shows that small caps are in the middle of an upward sloping relative uptrend channel and have little information about short-term direction. My inner trader is still watching for a test of the channel as a possible buy signal.
Stock prices are likely to grind higher into the summer months, and my inner investor is bullishly positioned. My inner trader has partial long market positions, and he is prepared to add to them on pullbacks.
Disclosure: Long SPXL
1 thought on “Could a weak consumer stall the economy?”
Comments are closed.
Cam
Thanks for updating your readers of some of the components of Leading economic indicators (LEI) that tend to roll over, warning an impending market top (see the article I posted today regards this from Urban Carmel in “discussions”).
With regards to what you have written here about housing sector, roll back the clock ten years back from today, circa 2008. That was the year when the first wave of housing foreclosures/bankruptcies started to hit Americans. It takes ten years to wipe credit delinquencies, and 2018 is the tenth year. Going forward, one could speculate that there will be a slow burn, increasing demand for housing from “clean” creditors. Anecdotally, talking to realtors, significant number of housing sales in some of US cities still tend to be cash (at the bottom of the market, it was around 70-80%, it is now somewhat lower 50-60%). Why is the homebuilders index to S&P ratio not showing an uptick? Well, home builder sentiment is at a peak at present. That said, home formation has not stopped in the US. Young men and women get married and start a family. This cycle has not stopped, last I checked. Such young families, are likely to buy their first homes, that tend to be smaller in size. Going forward, American homes are likely to be smaller, with lower profits for home builders (I do not have much data to prove this).
Trump administration relaxed some of the banking rules last week. As monetary policy enacted by the Fed tightens, fiscal policy MUST be relaxed to restore a balance. Some of this will be reflected in consumer debt, going forward. The graph you have shown from St. Louis Fed shows, consumer saving less (spending more). Credit card delinquencies are low (see your graph from the Federal reserve). The next graph you show from JP Morgan shows consumer debt service costs to be at historic lows. This shows a consumer that has been reliquifed (in the last decade). Weak consumers declared bankruptcies in the last decade, what was left was a stronger consumer.
Consumer America is 66% of US GDP. A consumer that is ready to spend is a confident consumer. One hopes to see loosening of consumer lending criteria going forward. Yes, autos are a larger portion of the US economy, but with ride sharing companies, perhaps there is a waning interest in cars (nor entirely sure about this, as the cars that are not purchased by consumer America, are likely to be purchased as fleet cars; furthermore, cars are more reliable, may be driven longer and as a consequence, Americans are driving older car; Results from Autozone and Oreilly automotive show that Americans are likely to keep repairing older cars, than buy new ones).
Let us see if the Federal reserve is able to enact a “soft landing” by not causing a policy mistake in tightening fed funds rates to much or too quick. That is a real test of Jerome Powell. Mr. Powell is willing to accept higher inflation (last week). Asset prices are likely to head higher, as a result. Joe six pack is still buying bonds. It is not over, until Joe six pack starts to buy equities with both hands.
We are in the second year of the presidential cycle, and historically, volatility continues till early fall (September/October). From the bottom of the second year to the peak of the third year, markets usually rise significantly, or so is the history. Let us see, if it works out this time, with a bit of help from the US congress (Fiscal policy) and the US fed (it would be a long and hard won policy victory). Oil prices, if they stay buoyant, should support higher equity prices (unless there is a steep rise in oil prices, as you suggested, past 100% in one year).