Preface: Explaining our market timing models
We maintain several market timing models, each with differing time horizons. The “Ultimate Market Timing Model” is a long-term market timing model based on the research outlined in our post, Building the ultimate market timing model. This model tends to generate only a handful of signals each decade.
The Trend Model is an asset allocation model which applies trend following principles based on the inputs of global stock and commodity price. This model has a shorter time horizon and tends to turn over about 4-6 times a year. In essence, it seeks to answer the question, “Is the trend in the global economy expansion (bullish) or contraction (bearish)?”
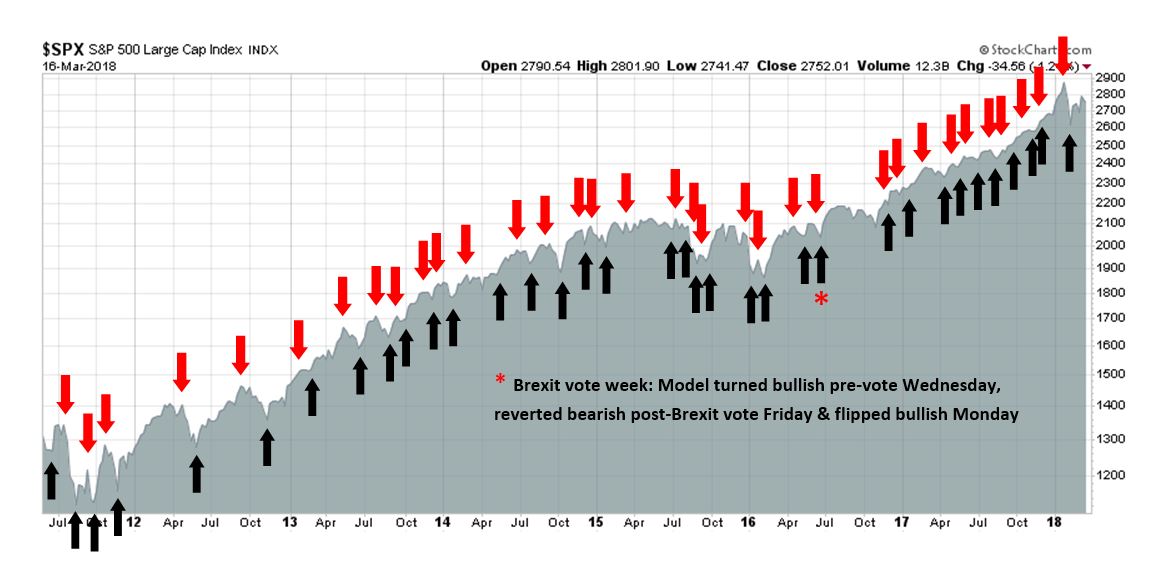
My inner trader uses the trading component of the Trend Model to look for changes in the direction of the main Trend Model signal. A bullish Trend Model signal that gets less bullish is a trading “sell” signal. Conversely, a bearish Trend Model signal that gets less bearish is a trading “buy” signal. The history of actual out-of-sample (not backtested) signals of the trading model are shown by the arrows in the chart below. The turnover rate of the trading model is high, and it has varied between 150% to 200% per month.
Subscribers receive real-time alerts of model changes, and a hypothetical trading record of the those email alerts are updated weekly here.
The latest signals of each model are as follows:
- Ultimate market timing model: Buy equities
- Trend Model signal: Bullish (upgrade)
- Trading model: Bullish
Update schedule: I generally update model readings on my site on weekends and tweet mid-week observations at @humblestudent. Subscribers receive real-time alerts of trading model changes, and a hypothetical trading record of the those email alerts is shown here.
A change in seasons
Bill McBride of Calculated Risk has had a remarkable record of calling turns in the economy. He correctly warned about the peaking housing bubble before it popped, and he has been consistently bullish since the market bottom in 2009. Recently, he warned that “the story is changing”:
But in 2018, the story is changing. We are seeing some economic tailwinds and some headwinds. Although the tax changes are poorly conceived, and mostly benefit high income earners, there should be some short term boost to economic growth. That might lead the Federal Reserve to raise rates a little quicker than anticipated.
He concluded:
I still think the economy will be fine in 2018, but the story is changing.
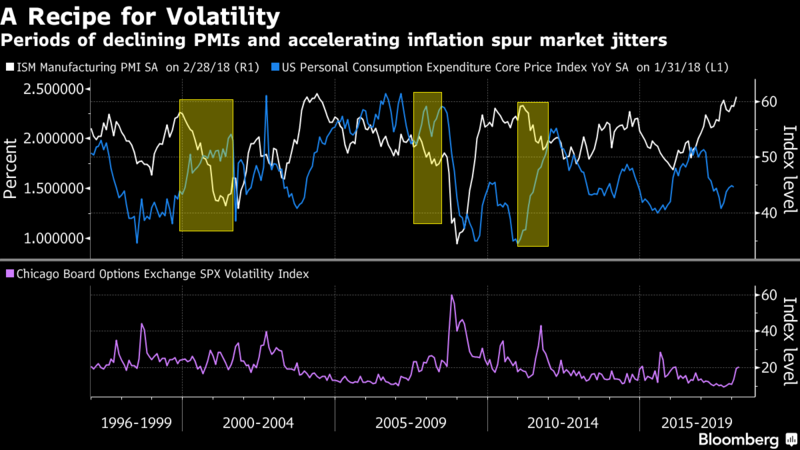
Bloomberg reported that Morgan Stanley cross-asset strategist Andrew Sheets highlighted a changing environment of weakening Purchasing Manager Indexes (PMIs) and rising inflation. Such regimes shifts have typically led to rising volatility.
Markets have traditionally been well-equipped to handle higher inflation when it comes alongside a pickup in growth, notes Sheets. But it’s the prospect of an inflection point away from the dominant narrative of “synchronized global growth” reflected in rising PMIs, and moribund price pressures that could cause investors angst.
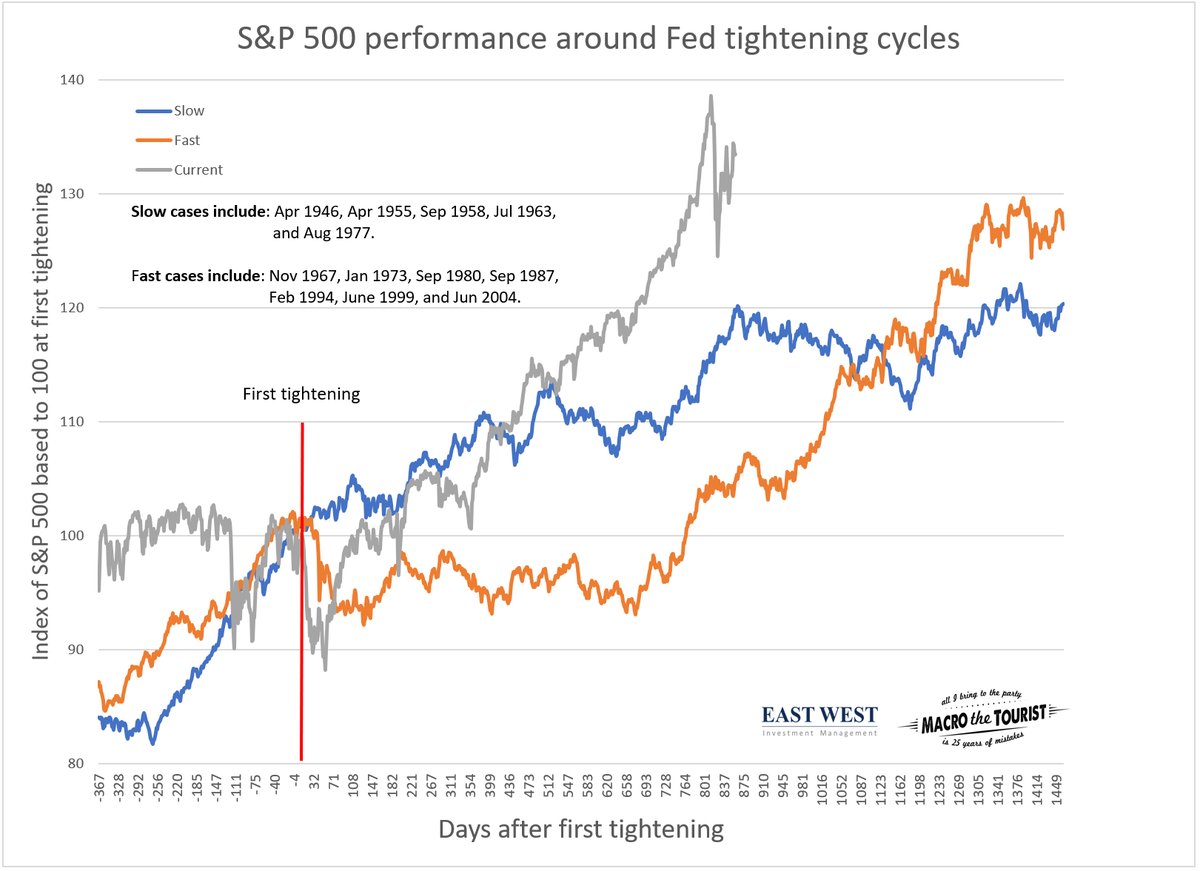
Kevin Muir at Macro Tourist also highlighted NDR analysis that split Fed tightening cycles to fast and slow cycles. If history is any guide, this is the point where stock prices start to flatten out and weaken during a slow tightening cycle.
I agree 100%. Goldilocks is dying, but the probability of a recession in 2018 remains low. Risks and volatility are rising. It is time to review how “the story has changed”.
A recession watch review
As McBride’s analysis was focused on the economy, it is useful to review how recession risk is changing. My main analytical framework is the long leading indicators outlined in my Recession Watch, which are designed to spot recessions a year in advance. With that in mind, my recession watch indicators are divided into three categories:
- Consumer and household sector
- Monetary conditions
- Corporate sector
Rising household and consumer stress
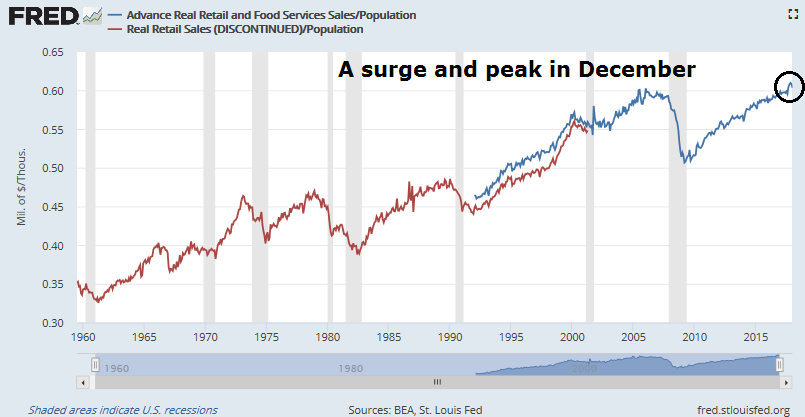
Starting with the consumer, this sector is starting to show some signs of weakness, but there is no clear and present danger just yet. Retail sales declined for three months in a row, and real retail sales peaked in December. However, the strength in retail sales late last year remarkable and the recent declines could be just a data blip.
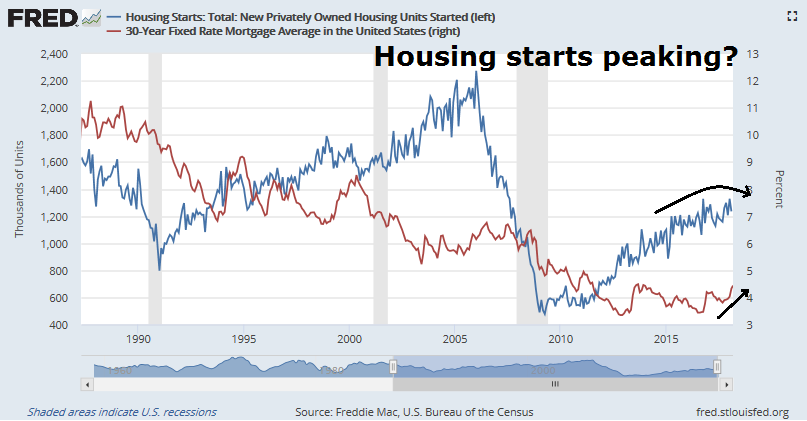
While retail sales measure current consumption, data series such as housing starts are more indicative of durable goods demand. The latest update on housing starts reveal a market that has plateaued and may be peaking. The combination of rising mortgage rates, and material costs of lumber and steel from trade actions are becoming headwinds in this highly cyclically sensitive sector of the economy.
A tightening Fed
How is the Fed reacting to these incipient signs of consumer weakness? Inflation surprise has been ticking up in the US and elsewhere, and the Fed has adopted a more hawkish tone. The risk of a policy error is rising. The Fed is engaged in a delicate balancing act, and the chances of a Fed-induced recession is rising rapidly.

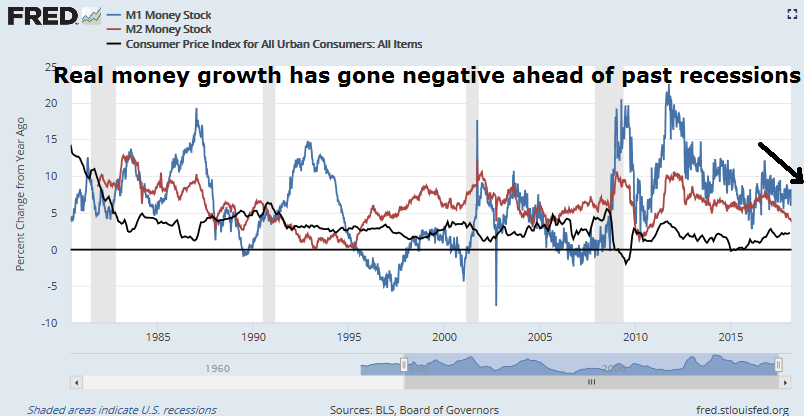
In the meantime, the tightness in monetary policy is showing up on money growth. In the past, real money growth, whether M1 or M2, has turned negative ahead of recessions. Today, real M2 growth is on pace to turn negative in the next few months, which would be a recessionary red flag.
We should get more clues about the direction of Fed policy from the FOMC statement next week.
Corporate sector still the bright spot
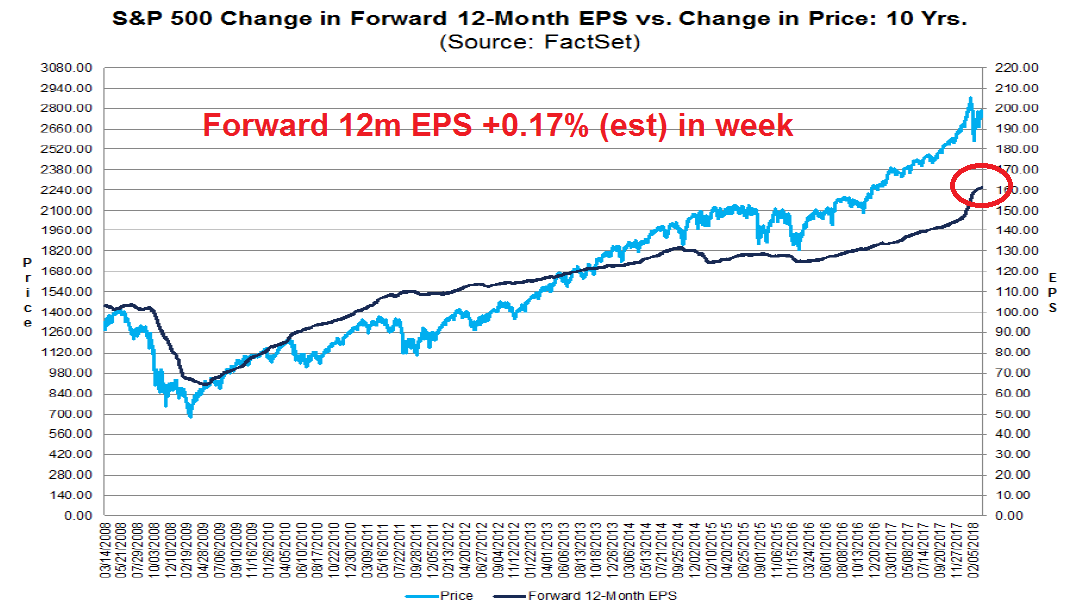
Over at the corporate sector, coincident market indicators such as forward 12-month EPS from FactSet is still rising. This is indicative of positive fundamental momentum, but this is an indicator that is coincidental to stock prices and do not forecast where the economy might be in the future.
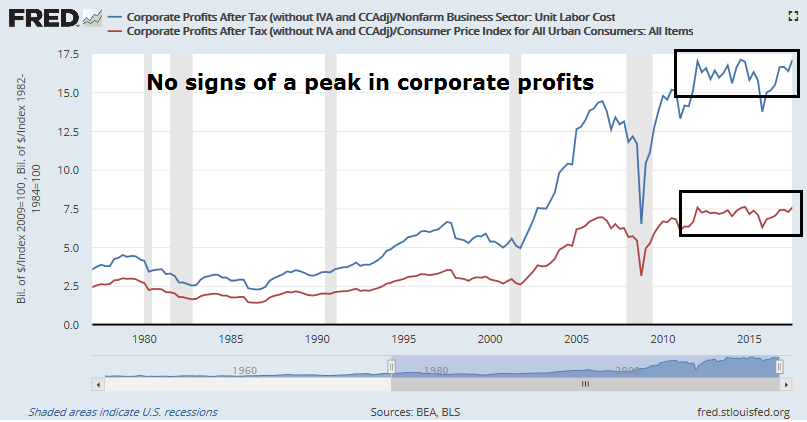
NIPA corporate profits, which is another one of my long leading indicator, remains healthy.
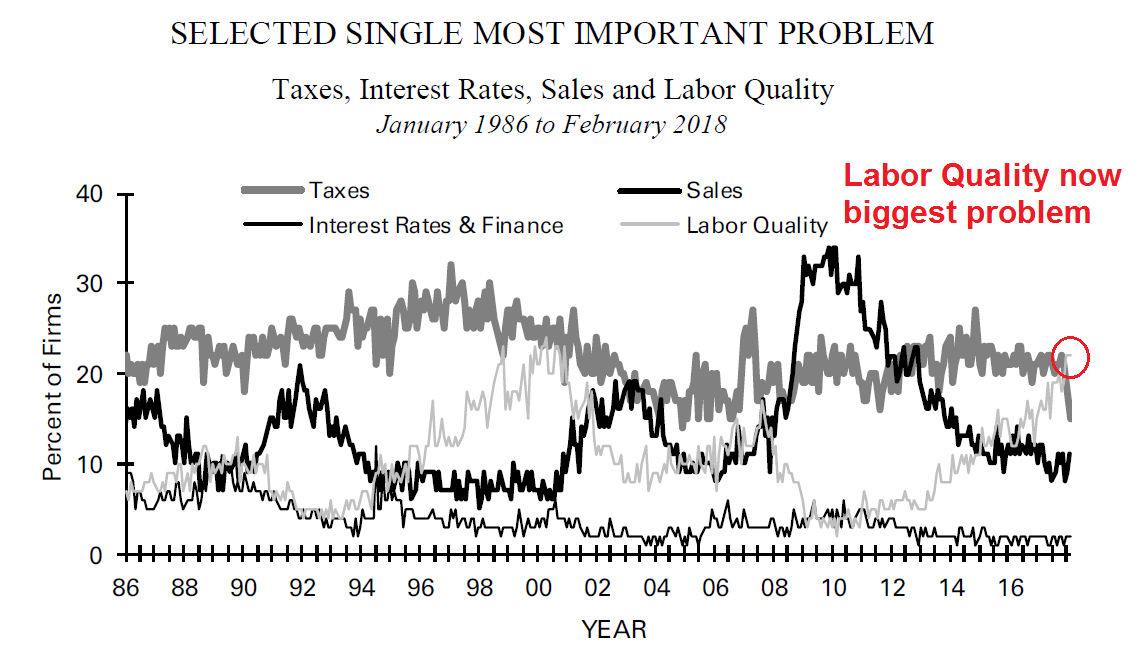
While the latest NFIB small business optimism survey surged to new highs, its internals reveal a number of disturbing internals beneath the surface. The survey of “single most important problem” shows that labor quality has rising to be the biggest problem, which is indicative of an overheating labor market that will undoubted concern Fed officials.
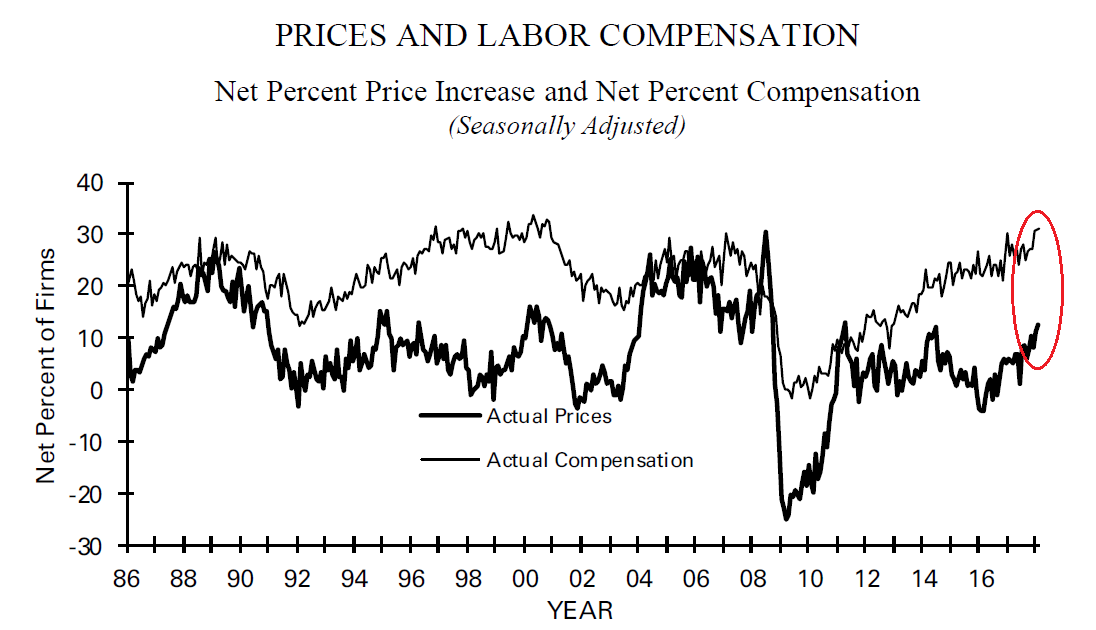
As well, the NFIB survey of prices and labor compensation reveals inflationary pressures in both wages and prices, which is a sign of cost-push inflation that will also raise eyebrows at the Fed.
For now, credit conditions remain benign. Until lending standards tighten, the risk of recession is likely to remain low.

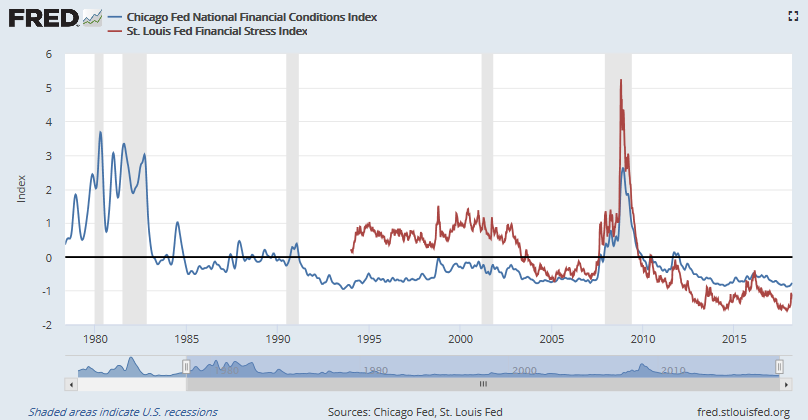
These readings are also consistent with the Fed’s own surveys of financial conditions, which have tightened marginally but remain at low levels.
In summary, a survey of leading indicators shows that recession risks are low, but rising. The consumer and household sector is under increasing stress, and monetary conditions are starting to tighten. However, the corporate sector remains healthy, and therefore the likelihood of a recession in 2018 is low.
New Deal democrat monitors high frequency economic releases and divides them into coincident, short leading, and long leading indicators. Here is his latest assessment of the US economy:
The nowcast and short term forecast are very positive. The long term forecast is weakly positive, with some improvement in the measures that have been fluctuating near neutral levels.
Be prepared!
One caveat to this analysis is it is focused on the economy. Since equity prices are leading indicators and recessions are bull market killers, investors will have far less warning than a year before a market peak and the onset of a bear market.
As “the story changes”, a shift from a bull to a bear market is likely ahead. Here is what I am watching to monitor downside risk in stock prices. Edward Harrison of Credit Writedowns worried about the risk of abrupt macro shocks:
I think of these credit shocks as being similar to how macroeconomic shocks happen. For example, I have often said that it is not the level of jobless claims that matter, it’s the change from one period to the next. So for example, every recession since unemployment insurance claims have been record has been led by or coincident with weekly initial jobless claims rising by 50,000 for a sustained period. There are no false positives either. That means that when the number of people who get thrown involuntarily out of work each week rises by 50,000 for a month or two, the loss of income is large enough to shock the economy into recession.
A shorter or smaller climb is digestible without recession. But, at some level, and I use 50,000 as the marker, it’s just too much of a shock to employment, income and consumption.
The same is true for credit. If the Fed raises rates too fast, the shock to speculative and Ponzi borrowers is too great for them to be able to hedge their bets. And they default. So it’s not the level that matters but the change in the level.
From a technical perspective, one clue of a market top may come from Chris Ciovacco’s trend models. Ciovacco monitors the 30, 40, and 50 week moving averages of the NYSE Composite. If they start turning down, then it would be a signal to reduce risk.
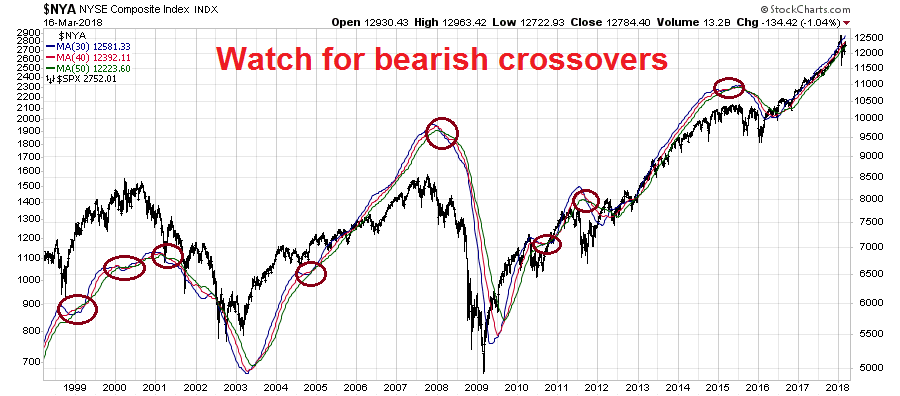
One drawback of Ciovacco’s models is their trend following nature, which are slow by design to spot market tops and bottoms. I am also watching for signs of a negative divergence in the 14-monthly RSI against the DJ Global Index, which will flash an early warning of a market top.

Should the market recover and rally either test the old highs or surge to new highs, a negative RSI divergence will give advance warning of heightened downside equity risk.
The week ahead
Looking to the week ahead, stock prices are likely to see a bullish bias. For one, CNBC reported that JPM derivative analyst Marko Kolanovic believes that the volatility storm has passed and market conditions are likely to return to normal.
The flow aspect of the sell-off had a striking similarity with the August 2015 sell-off: realized volatility caused derisking from volatility targeting strategies and forced covering of short volatility positions. Unless there is a recession, all of these flows tend to reverse within 1-2 months,
As my analysis has shown, the near-term risk of a recession is extremely low.
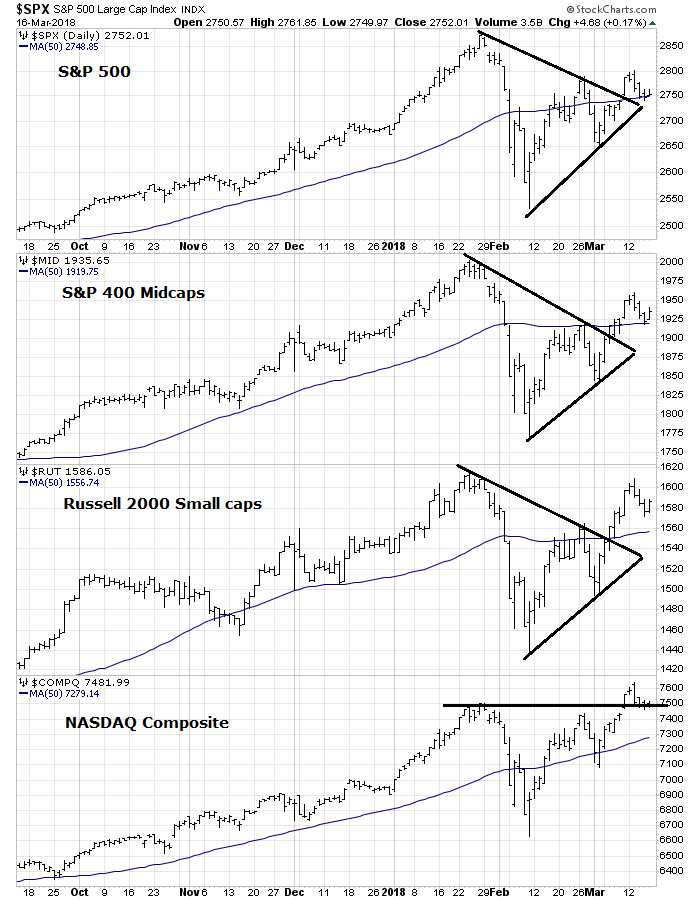
Arthur Hill identified a coiling formation in the DJIA and wrote that he “would still treat the consolidation as neutral and take [his] cue from the next directional break”.

As Hill waits for the directional break, we can get some clues as to the direction of the break by observing the other major US equity market indices, from large caps to small caps, as well as the NASDAQ. All have broken out upwards. All are above their 50 day moving averages (dma). The NASDAQ Composite staged an upside breakout and it is now testing the breakout level turned support.
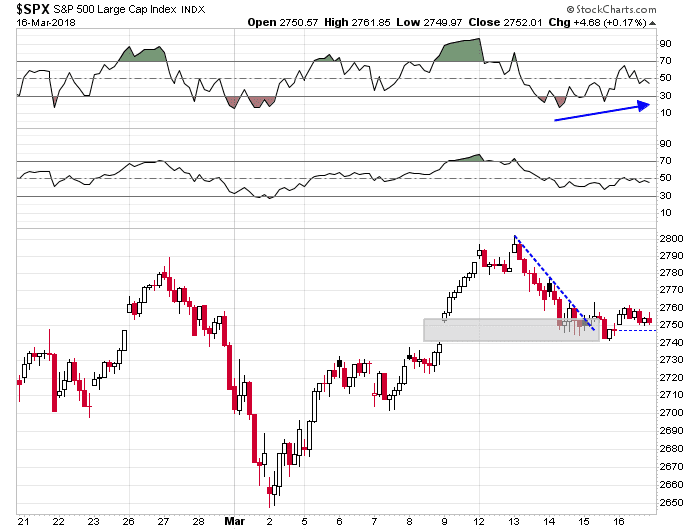
From a tactical perspective, the bulls impressively held off an assault by the bears last week. As the hourly chart shows, the bears filled the gap from the previous Friday but could go no further. The SPX went on to rally through a short-term downtrend and the hourly RSI-5 indicator flashed a bullish divergence.
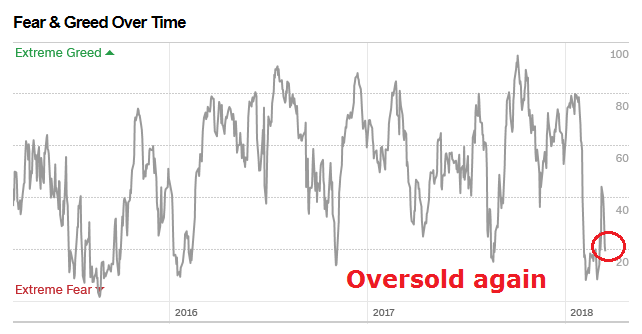
The Fear and Greed Index has fallen to 19, which is an oversold condition indicating a possible short-term sentiment washout.
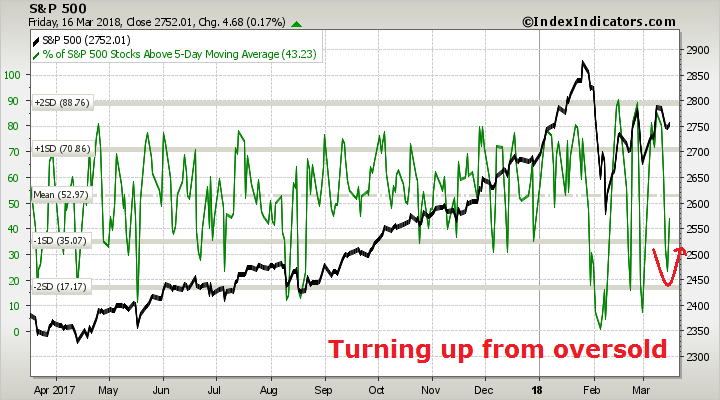
Short term breadth indicators have turned upwards from an oversold reading, which is also short-term bullish.
The one wildcard next week is the FOMC meeting. Tim Duy thinks that they will continue to signal three rate hikes, but bump up the “dot plot” to hint at four hikes this year.
Recent employment reports combine to tell a story of an economy that can sustain a faster pace of growth without pushing past capacity boundaries. That argues for leaving the Fed’s expected policy rate path intact. But Federal Reserve Chairman Jerome Powell’s testimony pointed to “avoiding overheating” as a policy objective while Federal Reserve Govenror Lael Brainard discussed at length the shift of economic forces from headwinds to tailwinds. She drew a comparison to 2015-16, when the Fed sharply reduced the pace of hikes relative to the projected rate path. Together, these discussions suggest the Fed sees a shifting balance of risks to the outlook. They will try to manage the risks accordingly, bumping up estimates of future rates while leaving open the option to switch to a more sharply more aggressive path if needed.
My inner investor is starting to get nervous about stocks, but he is maintaining the investment discipline of his models. He has found in the past that anticipating changes in model readings can lead to poor results, and waits for actual changes before actually reacting. Therefore he remains constructive on stock prices for the time being.
My inner trader believes that the correction is over, and the balance of risks point to another test of the previous highs.
Disclosure: Long SPXL
Hi Cam, how about todays market reaction? Thx Petr
As I write this at around noon ET Monday:
1) Fear & Greed at 14
2) VIX term structure nearly inverted
3) Short-term breadth very oversold
4) No major news, other than FB jitters
Major bearish impulses do not start with readings at these levels. Oversold markets can get more oversold, and the downside potential is the market tests its lows of early March.
Hi Cam,
Market is testing February lows, with this huge w shaped dip.
Will the 200 MVA hold?
Is the beginning of the end?
Thanks
Fede