Mid-week market update: Last weekend, I wrote that while I was intermediate term bullish, I expected some equity market weakness early in the week. The hourly RSI-5 had exceeded 90, which is an extremely overbought reading, which was not sustainable. Even during the January melt-up, such episodes resolved themselves with either a pullback or sideways consolidation. The downside risk is the 50 day moving average (dma) and the gap that was created when the market rallied on March 9, 2018.

Now that the market has declined to test the 50 dma, and the gap is filled, what now?
Buy the dip!
For now, I am inclined to give the bull case the benefit of the doubt. Measures of risk appetite remain healthy.

Breadth indicators are not exhibiting bearish divergences. They are either neutral or mildly bullish, as exemplified by the behavior of the NYSE A-D Line.

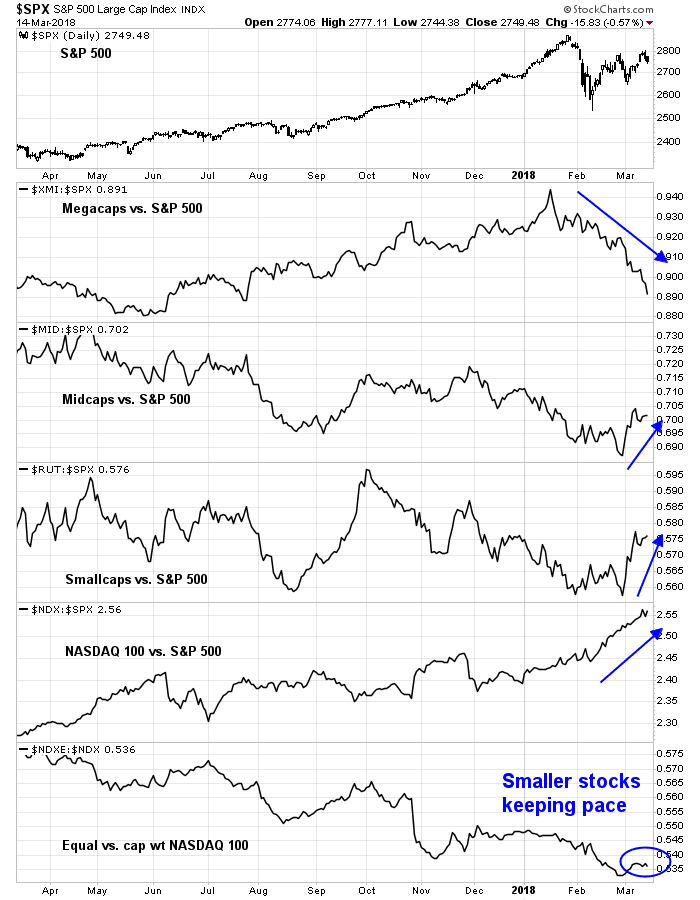
This chart of breadth by market cap presents a mixed but constructive picture. Both mid and small caps are staging comebacks relative to SPX, while megacaps (XMI) are underperforming. NASDAQ 100 is the clear leadership, though the equal weighted NASDAQ 100 is lagging the cap weight index. I interpret these readings of mid and small cap revival as bullish (troops leading generals). While some analysts have raised concerns about narrowness of NASDAQ leadership, the recent performance of the equal vs. cap weighted NASDAQ 100 shows that the smaller stocks in that index are keeping pace in this rally.
For the contrarian last word, Bloomberg reported that Dennis Gartman has turned bearish on stocks.

My inner trader remains bullishly positioned. He believes that the current bout of weakness is a great opportunity to buy the dip.
Disclosure: Long SPXL
Cam, I couldn’t agree more..Price action alone on the $SPX & the $NYAD remain bullish. Additionally, seasonally, the decennial pattern shows years ending in ‘8’ are strongly UP..Also, seasonally for the Dow, mid-term election years show a bottom in mid-March with a strong up-move into April..Lastly, the $SPX has dropped into strong support at 2739-2750..If anything, we should be buyers now..Thanks for your great insights..
Humble,
Looking at the Fed funds futures rates that Ken posted on 1/31, the slope of the Dec 2018 futures (black) and the slope of the Dec 2019 futures (grey) remain unchanged. Doesn’t this mean that the market hasn’t factored in the possibility of 4 rate increases and that the market remains vulnerable to the Fed bringing this up at the FOMC next week ?