Mid-week market update: One of the most reliable trading signals occur when an indicator becomes oversold and mean reverts to neutral (buy signal), or if it gets overbought and mean reverts to neutral (sell signal). We saw numerous versions of buy signals of that variety from the VIX Index this week.
Consider, for example, the VIX/VXV ratio as a measure of the VIX term structure. When this ratio rises above 1, that is an inverted term structure indicating market fear. As the chart below shows, the VIX/VXV ratio inverted last week and returned to a normal upward sloping curve on Monday.
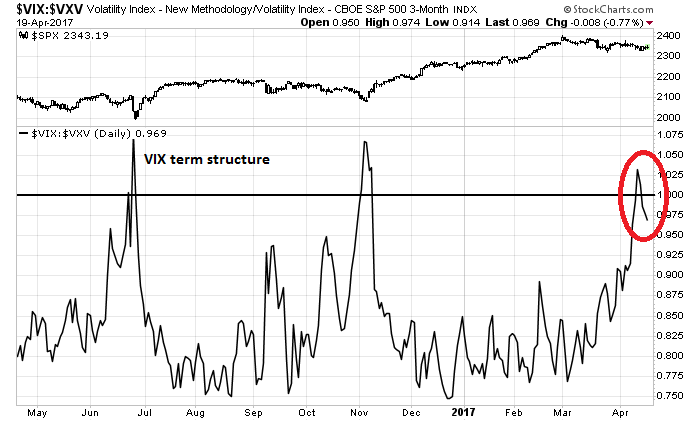
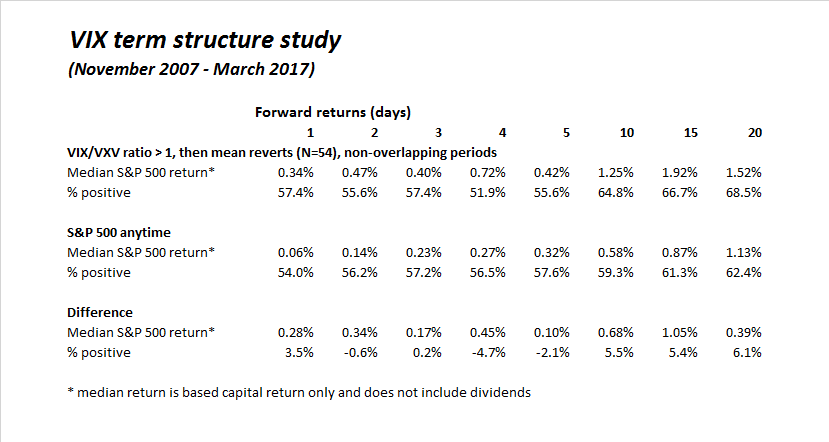
I went back to November 2007 and studied past instances of this buy signal. Historically, such episodes have resolved themselves bullishly.
That’s not all! There is more good news from the VIX for the bulls.
VIX Bollinger Band reversal
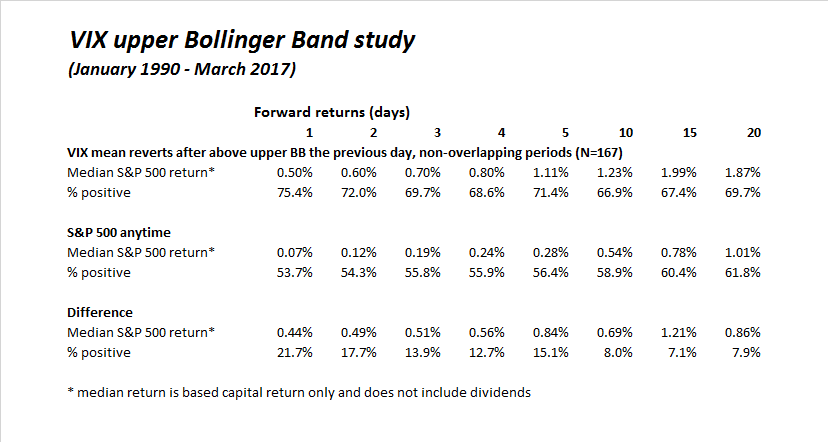
I have written before about the VIX Index rising above its upper Bollinger Band (BB) as a setup for a buy signal (see A capitulation bottom?). Last week, we saw the VIX rise above its upper BB. On Monday, it mean reverted to neutral.

Historical studies show that the odds are with the bulls when the market flashes this buy signal.
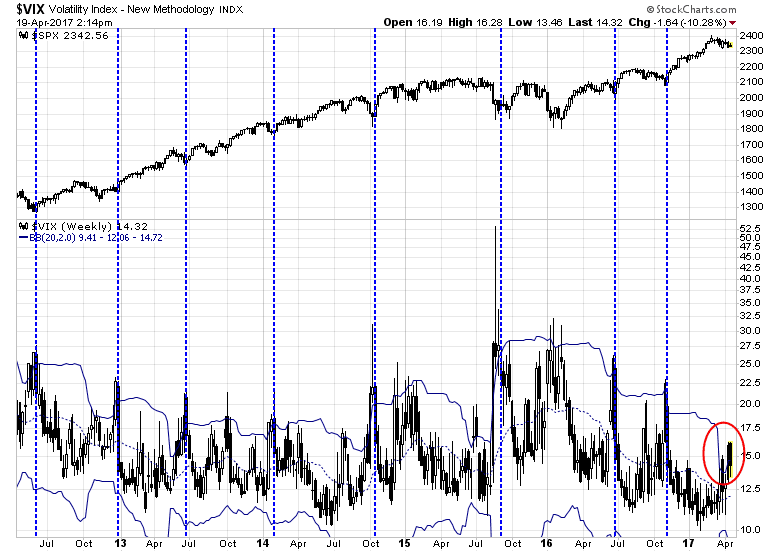
In addition, we are also seeing the rare condition of not only the VIX Index rising above its daily BB, but the weekly VIX above its BB (see Buy! The party is still going strongly). Should the VIX close at or near current levels, we will have a buy signal based on a weekly time horizon. The chart below shows that there were 8 signals in the last 5 years. This has been unabashedly bullish. With the exception of the double dip to test the lows in 2015, the market went straight up in all of the other cases.
VIX spikes in a market uptrend
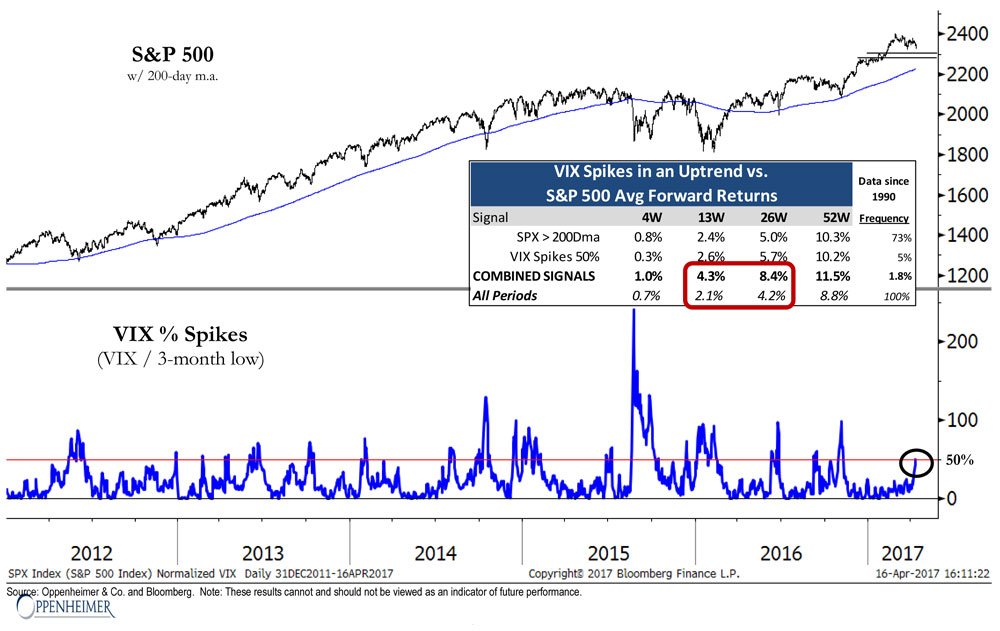
Finally, CNBC reported that Ari Wald of Oppenheimer found that VIX spikes while the market is in an uptrend, defined as the index above its 200 dma, it tends to foretell a period of turbocharged equity returns:
“We think you have to use these market pullbacks to add to your exposure; we think the bull market is intact,” Wald said Monday in an interview on CNBC’s “Trading Nation.”
Since 1990, when this signal between the VIX and the market is triggered as it was last Thursday, the average gain over the next six months has been 8 percent, versus 4 percent for any six-month period.
Key risk
In summary, differing interpretations of the VIX Index are all telling the story that we are seeing the start of a relief rally. What is puzzling about the current market environment is the lack of bullish follow through. Past bounces off oversold conditions have seen powerful upside momentum, which is not currently in evidence.
However, different measures of risk appetite continue to look positive, which is constructive for the bullish outlook. I will be keeping an eye on these metrics and would become more defensive if these internals were to deteriorate.
Disclosure: Long SPXL, TQQQ
Perhaps the lack of price response thus far is that the market suffered very little drawdown during the sell-off. From high to low it has only been 3%, which barely shows up on any chart.
But the Trump favorites had big pullbacks. Banks, the most favored fell over 8%.
Over the last month the general market only fell a bit because the favorites fell big while interest sensitive recovered.
The next leg up in the bull market will carry all sectors upward unlike after the November election. Then we saw interest rates soar and that sent rate sensitive sectors down while Trump favorites soared.
The worries about multiple rate hikes is fading away. That’s great for the economy and ALL sectors of the stock market this time.
It looks from my sentiment work and Cam’s that an intermediate sentiment low was put in last Thursday.
As you point out, small caps are showing more buoyancy than the S&P, and a look at $XVG and $VLE show that the average stock is doing better than headline stocks.
I am now rebasing my charts to last Thursday’s sentiment low. Here is how the industry sectors, the international and the style are performing versus the S&P500,
US industry group Leaders
https://product.datastream.com/dscharting/gateway.aspx?guid=795bccb7-e57a-4f64-bf81-71cf6dcbfa9e&action=REFRESH
US Industry group Laggards
https://product.datastream.com/dscharting/gateway.aspx?guid=b7039874-71b1-4251-9d1d-4101fb0bbcec&action=REFRESH
International
https://product.datastream.com/dscharting/gateway.aspx?guid=a4d96509-b414-4193-824b-94b3bb45376e&action=REFRESH
Style
https://product.datastream.com/dscharting/gateway.aspx?guid=ef6b920b-2f15-47f2-8195-391fb3514c00&action=REFRESH
Click on the URLs to see the chart. Keep them and they will update every day.
The industry group leadership is identical to the Trump post-election with the exception of REITs that are currently outperforming whereas they lagged back in November. This tells me the Trump favorites are back leading.
The international shows America leading all except for Japan. America is leading again just like November.
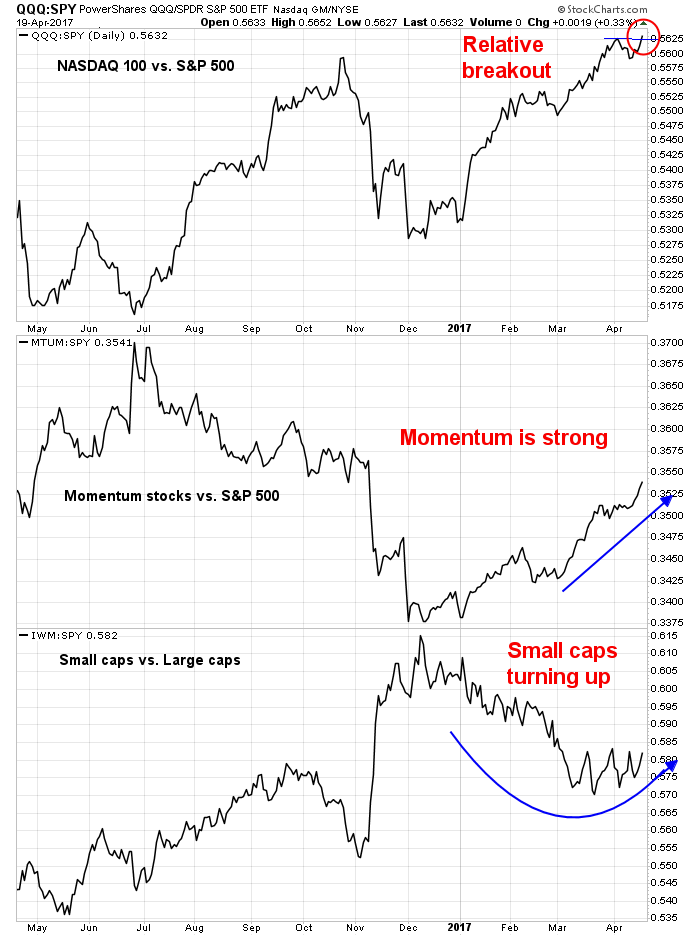
Style is different than post election. Momentum is leading whereas Value led post the election. My guess is that momentum is now comprised of Trump favorites that have outperformed for the last 5 months. When they started to lead from last week’s low, Momentum followed and led. Back in November when Value led, it was comprised of things like banks, industrials and other Clinton down trodden sectors that celebrated the Trump victory. Today Value is likely comprised of utility and staples that are cheap but out of favor.
In summary, the Trump bull market is alive and starting another leg. Stay with the momentum leaders.
Earnings are coming out quite well here, despite q1 being a slow quarter (which is usually the case). This would predicate rise in estimates for q2 (see Cams fastest graphs). With American consumer being well employed, earnings should keep ratcheting higher. The only unknown is inflation and how quickly the fed funds rate is increased by the US federal reserve and French elections near term. That said, French elections may not amount to much (Brexit would be an analogy).
“fastest” = Factset
Nice job! Per previous comment, VIX 15.99 also capped the move on closing basis and was huge tell in my work. 4/13 close 15.96 and 4/17 collapse.