Mid-week market update: Regular readers will know that I have been tactically cautious on the market for several weeks, but can the blogosphere please stop now with details of how many days it has been without a 1% decline?
The market fell -1.2% on Tuesday with no obvious catalyst. Despite today’s weak rally attempt, Urban Carmel pointed out that the market normally sees downside follow-through after 1% declines after calm periods.
Within that context, I offer the following three approaches to spotting a possible market bottom, with no preconceived notions about either the length or depth of the correction.
The Zweig Breadth Thrust oversold setup
The Zweig Breadth Thrust (ZBT) was originally conceived by Marty Zweig as a momentum buy signal for markets rocketing upwards (via Steven Achelis at Metastock):
A “Breadth Thrust” occurs when, during a 10-day period, the Breadth Thrust indicator rises from below 40% to above 61.5%. A “Thrust” indicates that the stock market has rapidly changed from an oversold condition to one of strength, but has not yet become overbought.
According to Dr. Zweig, there have only been fourteen Breadth Thrusts since 1945. The average gain following these fourteen Thrusts was 24.6% in an average time-frame of eleven months. Dr. Zweig also points out that most bull markets begin with a Breadth Thrust.
However, the setup for a ZBT can be a useful signal of a deeply oversold market. While we are not there yet, It is something to keep an eye on (use this link if you want to follow along at home).
Watch the VIX!
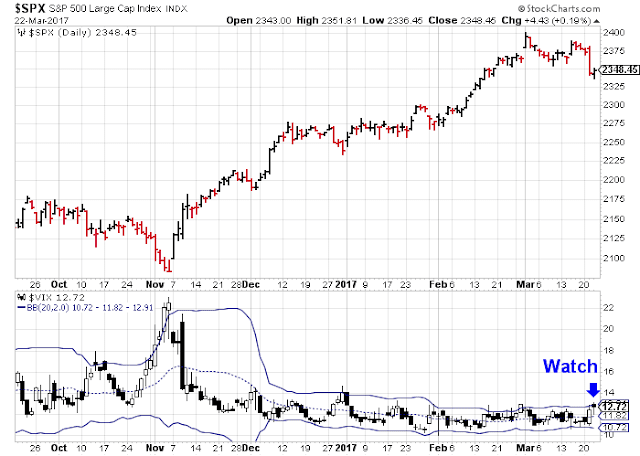
The recent low level of the VIX Index, at least by historical standards, has been puzzling. Nevertheless, the VIX does tend to spike during periods of market stress, and this episode should be no different.
I have been watching for an oversold condition, defined as the VIX rising above its upper Bollinger Band. So far, that hasn’t happened yet.
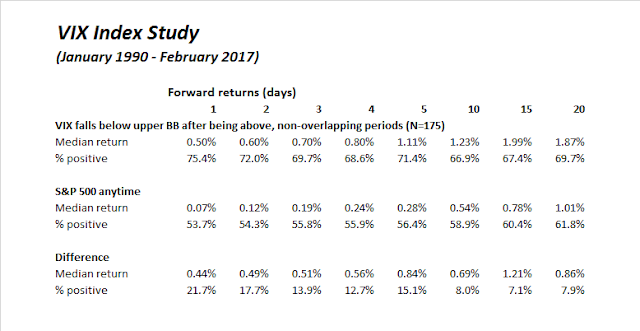
A mean reversion below the upper BB once the VIX has achieved the market oversold reading has been a reliable buy signal, as this study shows.
If you want to follow along at home, use this link for real-time updates.
Trifecta bottom spotting model
Finally, regular readers will be familiar with my Trifecta Bottom Spotting Model (click link for full details). The model uses the following three components to see if a market is oversold:
- VIX term structure: Everyone knows about the VIX Index as a fear indicator, but did you know about the term structure of the VIX? The VIX Index is the implied volatility of nearby at-the-money options. There is an additional index, the VXV, which is the implied volatility of at-the-money options with a three-month term. When the VIX/VXV ratio is above one, it indicates that anxiety levels in the option market is much higher today that it is in the future, which is an indication of excessive fear. The term structure of the VIX is far more useful as a sentiment indicator than sentiment surveys as it measures what traders are doing with their money in real-time.
- TRIN: The TRIN Index compares the number of advancing/declining issues to the volume of advancing/declining issues. When TRIN is above 2, selling volume is overwhelming even the advance/decline ratio – that is a sign of fear-driven and price-insensitive margin clerk market.
- Intermediate-term overbought/oversold indicator: The Trader’s Narrative showed me one of my favorite intermediate term overbought/oversold indicators. It is calculated by dividing the number of stocks above the 50 day moving average (dma) into the 150 dma. In effect, this ratio acts as an oscillator showing how quickly the market is moving up, or down. A reading of 0.5 or less usually marks an intermediate-term oversold condition.
In the past, the simultaneous trigger of all three components within a 2-3 day window of each other has been an uncanny signal of a market bottom. Even the trigger of two of the three components, which I call an Exacta Signal, has been pretty good. Right now, we are nowhere close (click this link if you want to follow along at home).
The caveat to the Trifecta Bottom Spotting Model, as well as all of the other models, is that they are oversold indicators. Oversold markets can, and do, get more oversold. So these models not totally infallible. Nevertheless, the use of these three tools should be able to allow traders to spot the likely inflection points in this market.
My inner trader has been short the market, and he is enjoying the ride.
Disclosure: Long SPXU, TZA


It would be so great if this type of analysis could be done on key industry groups like banking.
While the S&P 500 has had just a slight of just over 1% pullback from its closing high, the Bank ETF (KBE) is down 8.5%.
So, within general index we have the Trump winners falling while the Trump losers (utilities and staples) going up.
In my experience, short term trader’s biases are such that when new industry groups starts a big move up that catches them by surprise, they watch the group soar, wishing for a big pullback to get on board. But then when the pullback arrives, like what is happening to banks, they don’t buy. They get caught up in the negative short term news flow.
Whatever happens to healthcare passage, the future is bright for banking. Last count there are half a dozen former or current Goldman Sachs executives on the Trump team. Oversight will be VERY friendly. Interest rates very likely will go up. The US economy will do well.
Cam it would be great if you had a ‘Trifecta’ for this and other industry groups that could signal us a good short term point to jump on the bandwagon. I’ve found objective indicators are the best (only) way to cut through one’s emotions and the news feeds to make a good trade.