Mid-week market update: It was no surprise that the Fed raised rates, as they had spent the last month widely telegraphing their intentions. This morning’s release of February CPI tells the story. Headline CPI is near a 5-year high. Though core CPI (ex-food and energy) edged down, the latest reading of 2.2% is above the Fed’s 2% targeted inflation rate.
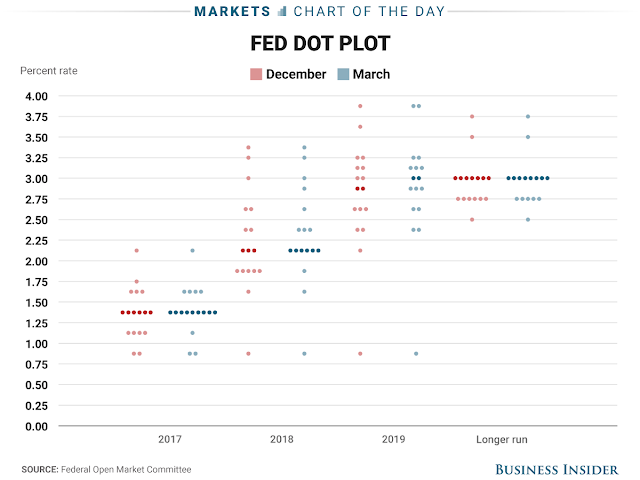
The big surprise was the dot plot, which the market anticipated would edge upwards. Instead it remained mostly unchanged for 2017, though rate expectations were nudged up for next year.
Since this is the third rate hike for the Federal Reserve, the key question for equity investors is whether they should be concerned about the traders’ adage of “three steps and a stumble” (via MTA):
Similar to Zweig’s Fed policy indicator and in line with the desire to measure when the Federal Reserve is tightening credit, Edson Gould, a legendary technical analyst from the 1930s through the 1970s, developed a simple rule about Federal Reserve policy that has an excellent record of foretelling a stock market decline. The rules states that “whenever the Federal Reserve raises either the federal funds target rate, margin requirements, or reserve requirements three consecutive times without a decline, the stock market is likely to suffer a substantial, perhaps serious, setback” (Schade, 2004). This simple rule is still relevants. Although it tends to lead a market top, it is something that should not be disregarded.
Here are the bull and bear cases under “three steps and a stumble”. In particular, the current economic cycle is elongated and shallow compared to past recoveries, and therefore it would be premature to worry about Fed actions to cool down the economy just yet.
The bull case for stocks
Jim Paulsen at Wells Fargo Asset Management summarized the bull case well by arguing that it’s far too early to worry about the effects of rising rates on stock prices:
When assessing the impact rising yields may have on the stock market, obviously it is important to gauge whether investor mindsets are primarily focused on inflation or deflation. Rising interest rates in a world where investors worry about inflation (i.e., when the correlation in Chart 1 is negative) is typically damaging for both the stock market and the bond market. However, if the predominant concern is deflation (i.e., when the correlation is positive), when yields rise, the stock market often performs well.
In the last year, bond yields have risen and the Fed now appears poised to raise the funds rate for a third time this week. Does this mean the stock market is headed for a stumble? Perhaps, but as shown in Chart 2, as long as the correlation between the stock market and bond yields remains so positive, history suggests it is more likely that the stock market simply keeps climbing as yields rise.
When stock and bond correlations are high, the market is worried about deflation. Therefore stock and bond prices move together. When the Fed first raises interest rates (which is usually in response to rising inflationary pressures), that’s good news for stocks because rising inflation implies better growth.
Paulsen divided the above stock bond correlation chart into quintiles. He found that stock prices tend to perform well when bond yields rise in the top quintile, which is where we are now.
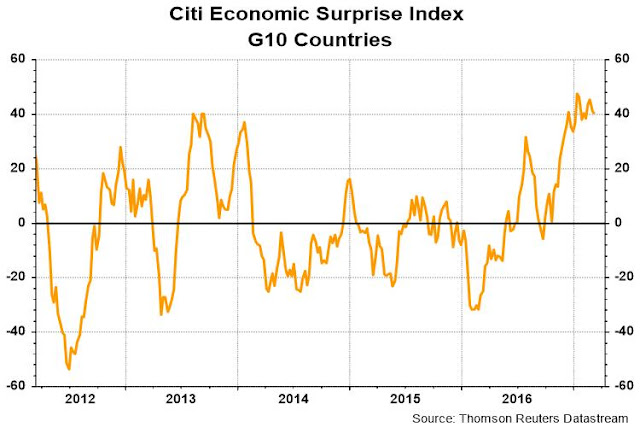
In a separate analysis, Paulsen showed that stock have tended to perform very well when the Global Economic Surprise Index (ESI) is high. (For newbies, the ESI measures whether high frequency economic data is beating or missing expectations),
Currently, Citigroup Global ESI readings are very upbeat.
In conclusion, investors should not worry about the intermediate term outlook for equity prices when growth is rising, even in the face of rising interest rates.
The bear case
There are a number of cracks in Paulsen’s bull case for equities in the current rising rate environment. First of all, inflation is rising, and it is just a matter of time before central bankers act decisively to head off an inflationary spiral. The chart below of Citigroup’s Inflation Surprise Index shows that the inflation surprise trend is global in scope. US inflation, which is the Fed’s focus, is a laggard among the major economies of the world.
Paulsen also focused the global ESI as a way of defining the equity return environment. While the global (G10) ESI remains upbeat, the synchronized global recovery isn’t that global anymore. In particular, Asia is starting to weaken. Here is the Japan ESI:
Here is the China ESI, which has recently plunged precipitously.
Bloomberg reported that Goldman Sachs strategists are getting concerned about equities because the global reflation cycle may be peaking:
“With growth momentum nearing its peak and rates increasing further with a hawkish Fed, the asymmetry for equities is turning increasingly negative,” Goldman analysts including Christian Mueller-Glissmann wrote in a note for institutional clients. “A slowing cycle makes equities more vulnerable to higher rates and also shocks, e.g. from European politics, U.S. policy, commodities or China.”
In addition, the current low volatility environment makes stock prices vulnerable to an violent unwind should the environment shift to risk-off:
The Goldman analysts also warned about trading dynamics in equities. Historically low volatility has pulled in “risk parity funds” that take their cue from risk levels, according to the team. “Commodity trading advisors” who gauge trends or momentum and use futures also tend to pile in to markets with low volatility and established trends, they wrote.
“In the event of a reversal of the trend, these systematic investors are likely to reduce equity exposure quickly, which could exacerbate an equity drawdown and result in a faster and larger volatility spike,” the Goldman analysts wrote.
Getting late in the party
I interpret these readings as the party is still going, but it’s getting late in the evening. It may be more appropriate to reset the timing of the first rate hike on the “three steps and a stumble” rule set last December’s raise as the first hike, with today’s as the second.
Paulsen is correct in that the rising growth outlook during the initial stages of a rate hike cycle overwhelms the negatives of rising interest rates. On the other hand, Goldman Sachs is also correct in their assessment of a deteriorating inflation and growth outlook. Don’t overstay the party.
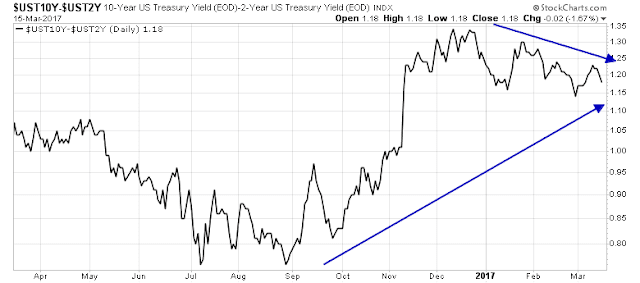
The key canary in the coalmine to watch is the yield curve. A steepening yield curve is an indication that the market expects better growth, while a flattening yield curve suggests that monetary policy has become aggressive and growth is likely to slow. The 2/10 yield curve had been steepening into the Fed meeting, but flattened in the wake of the FOMC decision, I am always wary of noisy instant market reactions. It’s always better to wait a few more days to see if the trend holds.
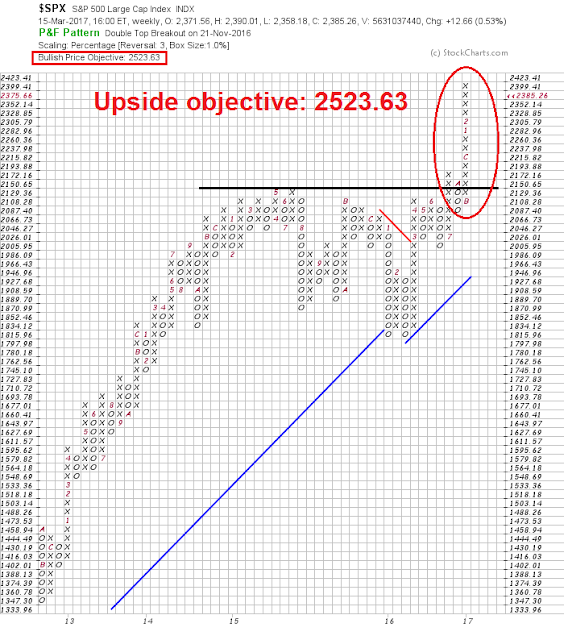
I remain of the view that US equity market highs have not been seen in this cycle. Therefore an SPX target of in the 2500-2600 range is still achievable as the ultimate peak for this year and for this bull market cycle.
But beware! The market is intermediate term overbought. Broad based indices like the Wilshire 5000 and Value Line Geometric have violated key uptrends, which may be a signal for a correction or consolidation. A 5-10% pullback could happen at any time.
Be prepared for volatility, but my inner investor is getting ready to buy any dip as long as the yield curve doesn’t sound any alarms.


The correlation of bonds and stocks in the study is a rolling 36 months but since the Trump election it has been extremely low. This has pulled down the current reading.
Technically the bond market is acting like it’s entered a bear market. Sentiment is not recovering from extreme pessimism when bonds rally a bit. This is an ominous sign for bonds. This means the correlation will stay low as bonds do poorly when stocks go up. At some point higher rates hurt housing and car industries as well as push equity valuation level to even higher extremes. Then stocks fall and bonds rise continuing the low correlation.
I’m concerned that in an internet communicating world, the sell signal may not need 36 months to roll into town. The pace of life is faster.
Don’t get me wrong, I’m not bearish but my Spidey senses are getting aroused. If the probability of a June Fed rate hike starts to soar along with strong stock markets and Trump policy agenda bogging down, I’ll very like shift to less equity exposure.
I have great respect for Robert Shiller and he just came out with a warning about stocks being too high and the Trump boom narrative being a new collective human folly. He’s always been early but…..
Excuse me for my mouth running on but here is an interesting happening. This is the chart of Fed Funds futures prices for the end of 2017 and 2018.
https://product.datastream.com/dscharting/gateway.aspx?guid=1a1362e2-8a6d-4541-918a-2be4b9280d63&action=REFRESH
I drew a new horizontal line (light green dotted) at yesterday’s price. Today both fell from there which means that Yellen’s message was more dovish than expected. You can see last December they rose after that meeting when she sounded hawkish then.
I watch this often. If it stays tame I expect markets to get a boost.
Note the sharp rise over the last month going into today’s meeting as the probability of a hike went from low to 100%. This stalled the stock market.
If we see another big rise before the April or June meetings in my mind that would be a big negative.
Keep the URL link if it interests you. It updates daily.
Expanding on Cam and Ken’s conclusion about inflation and the dovish response of the Fed Fund futures it is interesting to note that the dollar was down sharply and gold and gold mining stocks were up. One day does not a trend make but it might be the early signs of inflation. If that is the case down the road the bond market will be more sensitive to inflation worries.
As a clarification, the FED uses Core PCE as the 2% target rate. https://www.advisorperspectives.com/dshort/updates/2017/03/02/two-measures-of-inflation-and-fed-policy?channel=Income
The latest Cleveland FED Inflation Nowcasting web site shows March Core PCE at 1.78
https://www.clevelandfed.org/en/our-research/indicators-and-data/inflation-nowcasting.aspx
Wage inflation is greatly muted compared to the end of previous business cycles
https://fred.stlouisfed.org/graph/?graph_id=368319
Cam,there could be one more leg up in April 2-4% and fall in may 5-10% satisfying seasonal trend
Anything is possible. We could see a minor pullback for the rest of March and then rally in April.
Watch the data.