As 2016 has drawn to a close, it’s time to review the report card from my 2016 calls. My inner investor performed very well, though my inner trader suffered a number of hiccups. Overall, I had a solid year in 2016.
My inner investor: Steadfastly bullish
The chart below depicts the key highlights of my investment calls, which are based on a 6-24 month time horizon. I remained steadfastly bullish for most of 2016 even as others panicked. The jury is still out on my latest call for a correction in early 2017 (see A correction on the horizon?). My analysis has turned out to be largely correct.
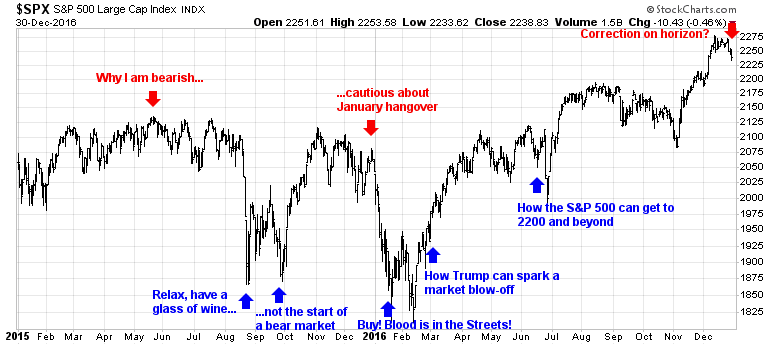
Buy! Blood is in the streets! (January 2016)
Super Tuesday Special: How President Trump could spark a market blow-off (March 2016)
How the SPX could get to 2200 and beyond (June 2016)
A correction on the horizon? (December 2016, the jury is still out on that call)
My inner trader: The devil is in the details
The chart below depicts the calls of my trading model. While they appeared to be very good at first glance, I discovered a couple of problems in implementing the trades.
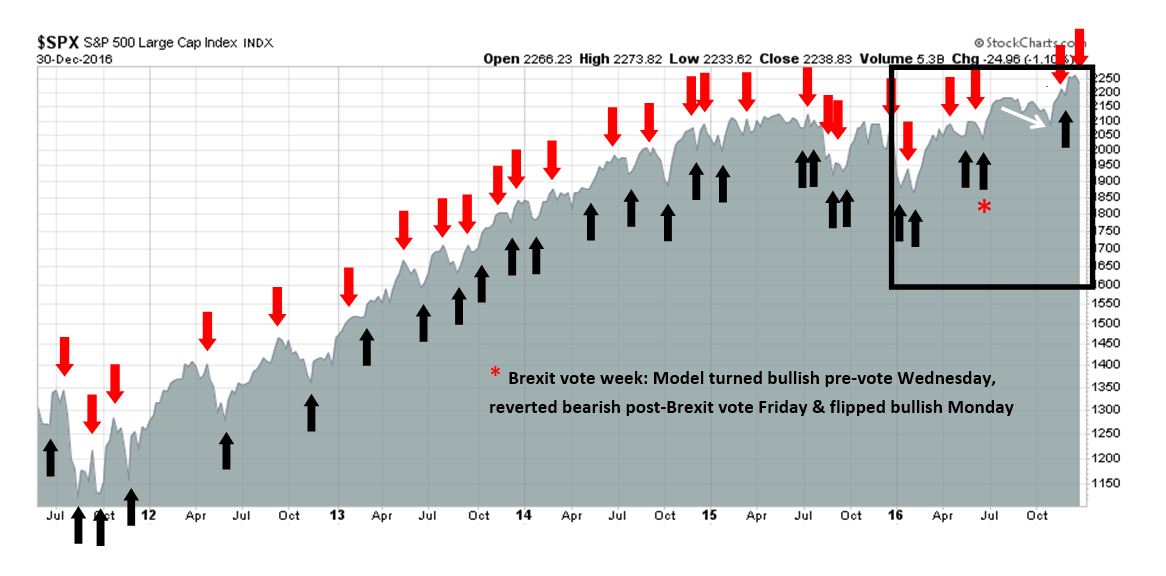
First, the model was a little slow and did not react to the slow deterioration in the market during the late summer. Even as the model remained long, the slow drip-drip-drip downtrend in prices (marked by the white arrow in the chart) was a little disconcerting. As the trading model is based on sensing changes in price trends, the lack of trade signals highlights a problem when the market moves sideways.
On the other hand, another problem arose when the model became overly sensitized to changes in prices. The trading model experienced whipsawing signals in the aftermath of the Brexit election (buy to sell to buy within a few days) and the US election (buy to sell to buy in the overnight futures market). These two issue highlight the need for further research in the future.
These problems highlight the problem with short-term trading and trading models. The chart above is a weekly chart and therefore does not show the actual price volatility experienced by traders.
Sometimes trading is like that. You think you have the perfect setup, followed by the perfect signal, then you miss on your execution, which results in an unfortunate outcome (click this link if the video is not visible).
I have no idea of what 2017 will bring, though I outlined my market views in my last post (see The cloudy side of Trump). In all likelihood, the incoming Trump administration will create a high degree of uncertainty and market volatility.
I hope that I can help you navigate it in the year to come.
Will you send me or post the dates for the Inner Investor Model. Thanks.
Thank you, Cam , for guidance through the year. May you and yours have a wonderful and blessed 2017!
The down arrow on the top most chart, does that mean the “inner investor” as well as “inner trader” are risk off?
The arrows on the first chart represents my “inner investor”. You will note that turnover for this model is far lower than the other model.
The arrows on the second chart are more frequent and represents my “inner trader”.
Hi Cam,
I appreciate your columns and your buy/sell announcements. Can you send me your buy/sell dates for the past three years? 2014, 15 and 16?
Thanks
Dave Razo
Hi Cam
I still have the same question Keith does. The intermediate term chart above has a new red down arrow (risk-off) while the narrative in the latest article has “risk-on”. Has the Intermediate term chart changed to downtrend / risk-off?
Thanks, Doug
Upon further reflection, I was premature in labeling the latest correction as a down arrow. The trend model remains in risk-on mode.
My apologies.
Great information. Well organized. I follow your inner investor rather than the trader so I’m perfectly happy. Thanks.
I expect your inner investor will have a great year in 2017.