Mid-week market update: Did you think that a market bottom was going to be this easy? I got worried on Monday when I received several congratulatory messages and high-fives for my weekend tactical bullish call (see Macro weakness: Just a flesh wound?). That rebound seemed a bit too easy. especially when I saw the latest research report from JPM derivatives analyst Marko Kolanovic.
Forget about the usual explanations about rising bond yields, uncertainty over Fed actions or the credibility of the ECB, BoJ, etc. Kolanovic advanced a positioning explanation the market turmoil (via Value Walk):
The stock market needs to move only 1% to 2% lower for volatility to dramatically increase to the downside, as highly leveraged strategies could engage in mechanical selling.
“Given the low levels of volatility, leverage in systematic strategies such as Volatility Targeting and Risk Parity is now near alltime highs,” Kolanovic wrote. “The same is true for CTA funds who run near-record levels of equity exposure.”
When markets are pushed to extremes, the snap-back to normalcy can be hard. Kolanovic notes that record leverage in these strategies could push the market lower and volatility higher. The market might not even need a catalyst to increase volatility, seasonality in September and October could do the trick. When the systematic strategies start to deleverage nearly $100 billion in assets could be pulled from the stock market, Kolanovic projected.
In other words, a number of algo driven strategies, such as CTAs and risk parity funds, got into a levered crowded trade during the period of low volatility. The sell-off on Friday was the trigger for an unwind of that trade. According to Kolanovic, it could be very ugly.
There is some good news and bad news for the bulls. The good news, according to this Dana Lyons historical study, suggests that downside risk is limited at current levels. The bad news is the market is likely to be choppy and volatile for the next few weeks.

With that trading environment in mind, I can offer traders a couple of near sure-fire ways of spotting market bottoms.
Zweig Breadth Thrust setup
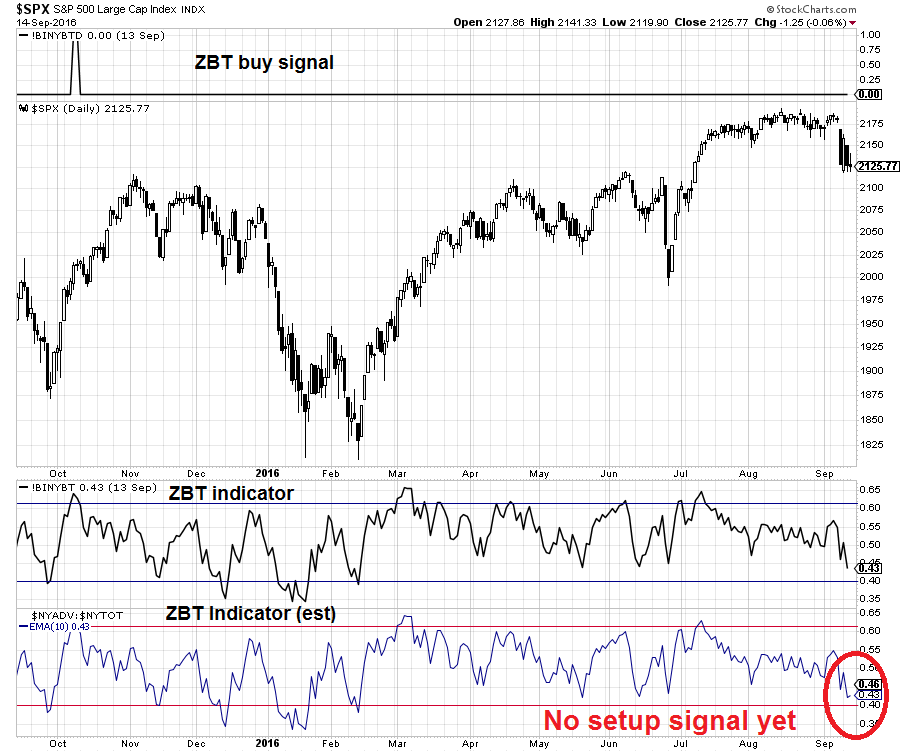
I have written about the Zweig Breadth Thrust before (for an explanation see A possible, but rare bull market signal). The key isn’t so much realizing the full ZBT buy signal, but watching for the oversold condition that sets up a possible ZBT signal.
We don’t have a ZBT setup yet, but this is a relatively rare oversold signal to watch for. The ZBT Indicator will signal a setup when it fall below 0.40. As stockcharts.com can be sometimes slow in updating their data, I use the bottom panel to calculate an approximation for the ZBT Indicator. For readers who want to follow along at home, please use this link to get an update of the chart below.
Trifecta Bottom Spotting Model
I have also written about my Trifecta Bottom Spotting Model, which has shown an uncanny 88% success rate in the last few years (for a full explanation use this link). The last time this signal was triggered, it managed to pick the exact day of the bottom on the Monday after the Brexit panic (see Hitting the Brexit trifecta).
As a reminder, the Trifecta Model is based on the following three elements:
- VIX term structure: Everyone knows about the VIX Index as a fear indicator, but did you know about the term structure of the VIX? The VIX Index is the implied volatility of nearby at-the-money options. There is an additional index, the VXV, which is the implied volatility of at-the-money options with a three-month term. When the VIX/VXV ratio is above one, it indicates that anxiety levels in the option market is much higher today that it is in the future, which is an indication of excessive fear. The term structure of the VIX is far more useful as a sentiment indicator than sentiment surveys as it measures what traders are doing with their money in real-time.
- TRIN: The TRIN Index compares the number of advancing/declining issues to the volume of advancing/declining issues. When TRIN is above 2, selling volume is overwhelming even the advance/decline ratio – that is a sign of fear-driven and price-insensitive margin clerk market.
- Intermediate-term overbought/oversold indicator: The Trader’s Narrative showed me one of my favorite intermediate term overbought/oversold indicators. It is calculated by dividing the number of stocks above the 50 day moving average (dma) into the 150 dma. In effect, this ratio acts as an oscillator showing how quickly the market is moving up, or down. A reading of 0.5 or less usually marks an intermediate-term oversold condition.
As the chart below shows, the VIX/VXV ratio is below 1 and therefore not inverted, indicating extreme fear. However, TRIN did spike to 3.17 on Tuesday, which is indicative of the kind of price insensitive selling consistent with Marko Kolanovic’s thesis of large scale portfolio re-positioning. The OBOS model is nearing an oversold reading, but not yet.

For readers who would like to follow the progress of this model at home, please use this link. I would point out that stockcharts.com does not update the elements of the OBOS model on an intraday basis, but there is a quick-and-dirty fix to that. You can approximate the OBOS by estimating its elements. First, IndexIndicators.com does offer temporary time-delayed updates of stocks above their 50 dma.

While they don’t offer stocks above their 150 dma, they do show stocks above their 100 dma…
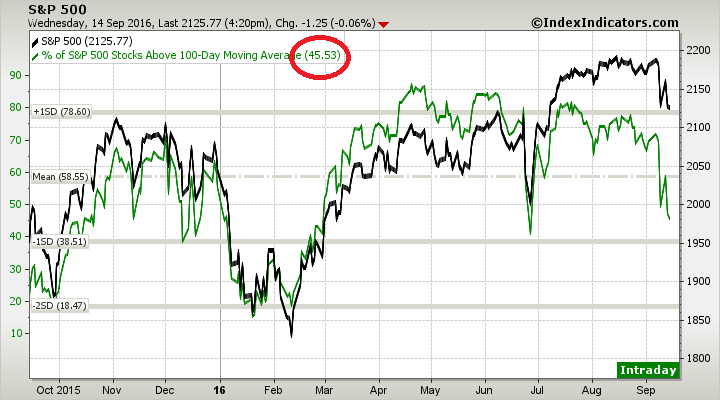
…and stocks above their 200 dma.

We can then make a first order approximation of the OBOS model with stocks above 50 dma /((stocks above 100 dma + stocks above 200 dma)/2). Further, we can add a “fudge factor” by observing that the actual reported OBOS reading was 0.53 on Tuesday and Tuesday’s approximation using IndexIndicators.com data was 0.56. The difference, or “fudge factor”, is -0.03. We therefore subtract 0.03 from the real-time IndexIndicators.com to approximate an OBOS reading.
Based on Wednesday’s closing figures, we arrive at a OBOS model reading of 0.53, which is unchanged from Tuesday.
Where are we now?
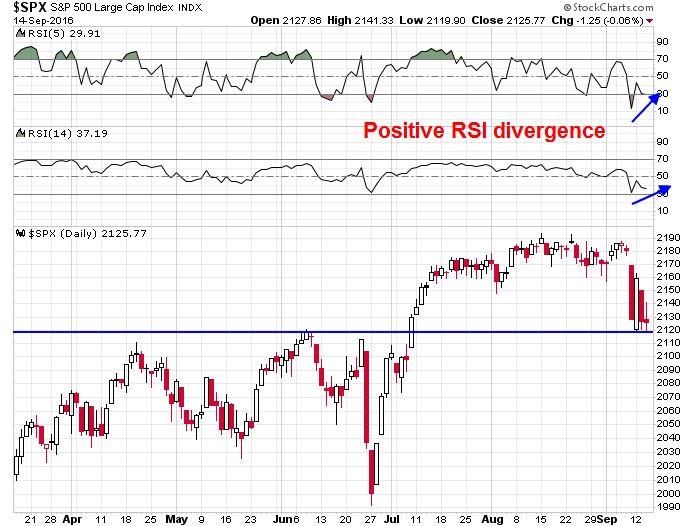
In closing, the market appears to be short-term oversold on many breadth metrics, such as stocks above their 10 dma.

In addition, there was a positive RSI-5 divergence and a minor RSI-14 divergences when the SPX tested a key support level. Based on these readings, the risk-reward is skewed to the upside.
However, the unwind that Kolanovic postulated may not be complete. My inner trader is keeping his long position and watching for signs of a capitulation and market washout based on my aforementioned indicators before he uses his remaining cash.
Disclosure: Long SPXL, TNA
*** UPDATE *** The intermediate term OBOS model closed Wednesday at 0.48, which is an oversold reading. With TRIN spiking above 2 on Tuesday, we now have a “exacta” signal.
I would still be more comfortable with a final capitulative sell-off before adding to my long trading position, however.
So they don’t need to signal on the same day?
No, just within a 3-5 day window. The narrower the window, the better.