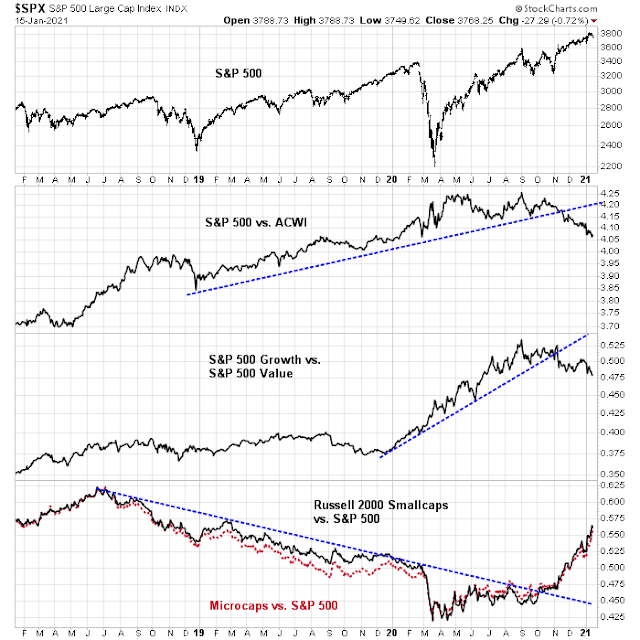
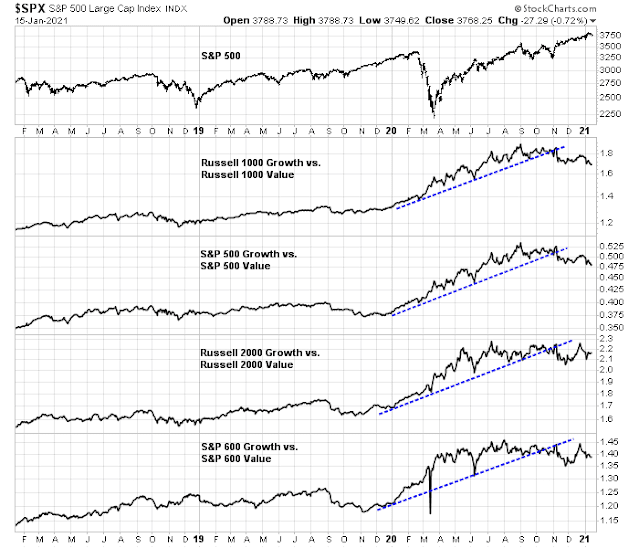
In the wake of my Great Rotation publication (see Everything you need to know about the Great Rotation but were afraid to ask), it’s time for an update of how global regions and US sectors are performing. The short summary is the change in leadership of global over US stocks, value over growth, and small caps over large caps are still intact.
While the long-term trends remain in place, some tactical caution may be in order in certain parts of the market.
Global leadership patterns
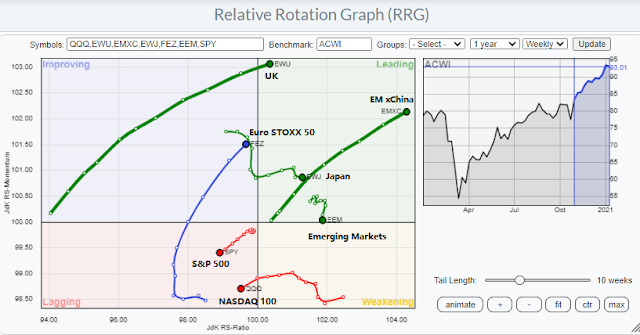
For the purposes of analyzing change in leadership, I use the Relative Rotation Graphs, or RRG charts, as the primary tool for the analysis of sector and style leadership. As an explanation, RRG charts are a way of depicting the changes in leadership in different groups, such as sectors, countries or regions, or market factors. The charts are organized into four quadrants. The typical group rotation pattern occurs in a clockwise fashion. Leading groups (top right) deteriorate to weakening groups (bottom right), which then rotates to lagging groups (bottom left), which changes to improving groups (top left), and finally completes the cycle by improving to leading groups (top right) again.
The RRG analysis of global regions is clear. Avoid US equities. The only regions in the bottom half of the chart are US indices.
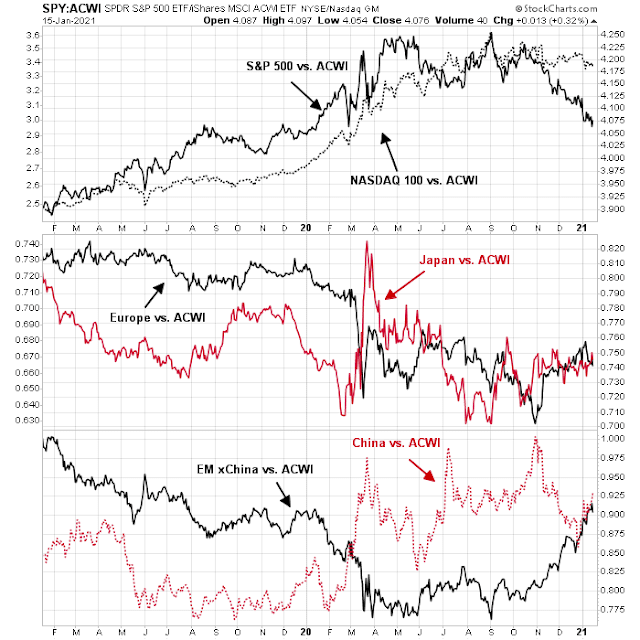
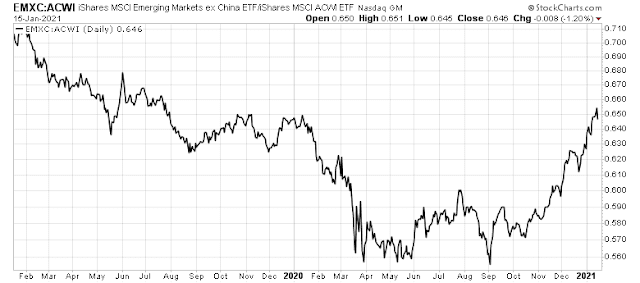
A more detailed analysis of relative performance against the MSCI All-Country World Index (ACWI) shows that the S&P 500 and NASDAQ 100 losing steam, major developed markets like Europe and Japan trading mostly sideways, and EM xChina the best relative performer. EM xChina’s strong relative performance is mainly attributable to that region’s high cyclical exposure, though the region may be vulnerable in the short-run owing to the extended nature of the recent rally.
Sector rotation analysis
The RRG analysis of US sector held few surprises. Large-cap growth sectors such as technology, communication services, and consumer discretionary (AMZN, TSLA) were in the weakening quadrant. Defensive sectors, such as consumer staple, utilities and real estate, were in the lagging quadrant owing to the strong market rally since the November Vaccine Monday rally began. Unloved value sectors such as energy and financials are in the leading quadrant.
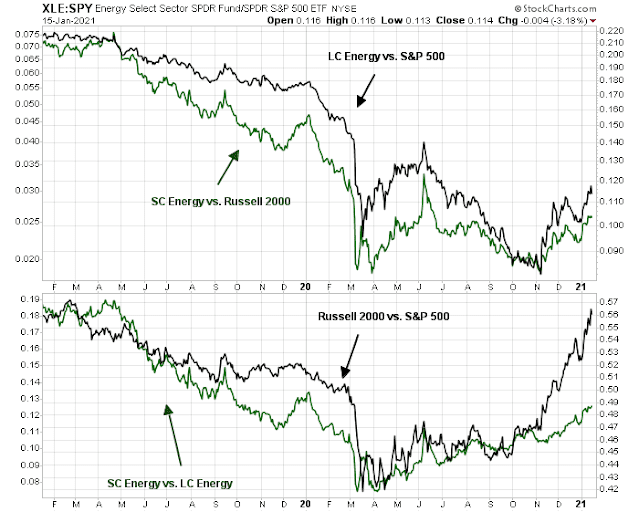
A closer examination of the two leading sectors, energy and financials, reveal some key differences. Both large and small cap energy stocks are beating their respective benchmarks and showing similar patterns (top panel), but the degree of outperformance of small to large cap energy (bottom panel, green line) lags the relative performance of the Russell 2000 to S&P 500. If energy stocks are to remain market leaders, there may be some opportunity in small cap energy.
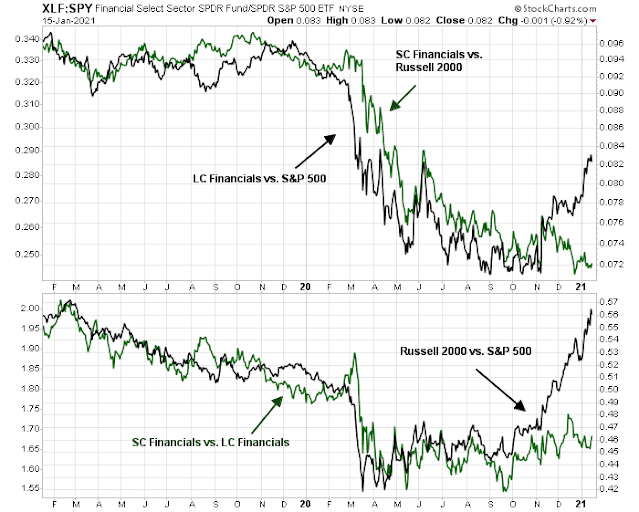
The analysis of large and small cap financial stocks tells a different story. While large cap financials have begun to recover, small caps have not shown the same relative performance pattern (top panel). The yield curve has been steepening, which should be positive for banking profitability, but the lagging leadership of small cap financial stocks is a blemish for the sector.
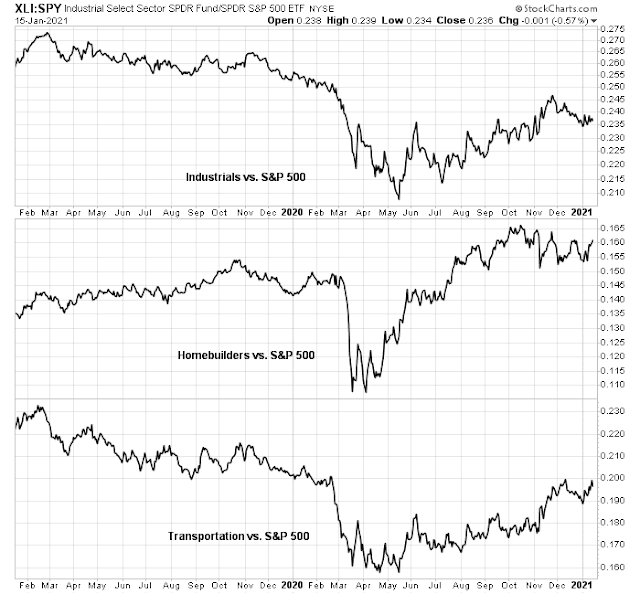
The big surprise from the RRG chart was the deterioration in relative strength seen in cyclical sectors such as materials and industrials. In theory these sectors should be performing well as the global economy recovers from the pandemic. Instead, the relative performance of cyclical sectors and industries have begun to flatten out.
A cyclical pause?
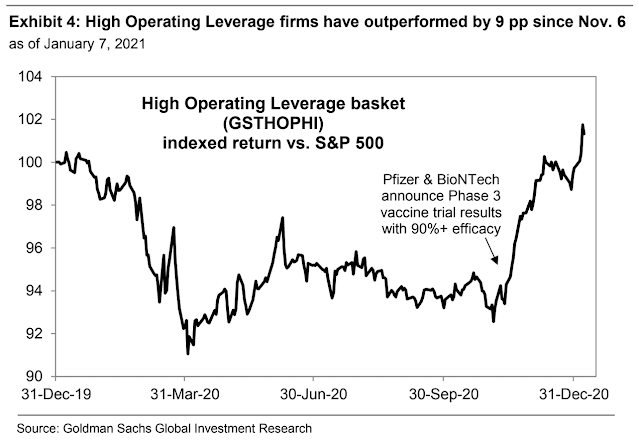
Signs are growing that the expectations of a cyclical recovery has grown too far, too fast. In a recovery, companies with high financial and operating leverage should perform well, and indeed the high operating leverage basket has rocketed upwards against the S&P 500 since Vaccine Monday. Cyclical stocks may have risen too far, too fast.
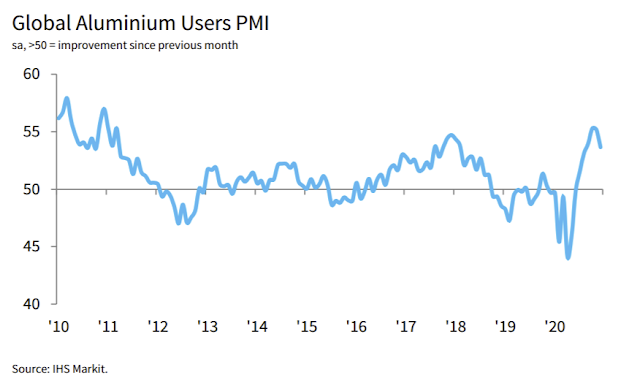
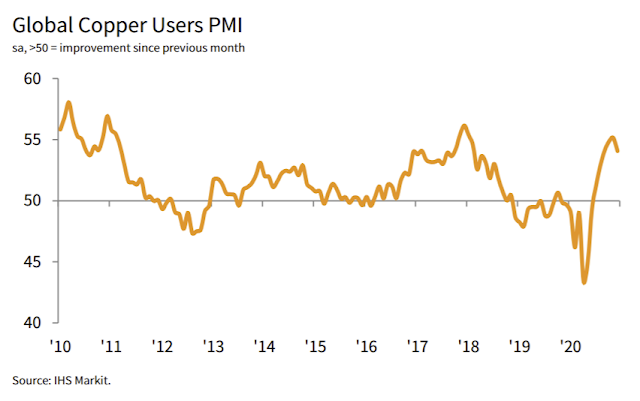
The global cyclical recovery trade appears ready to take a breather. Callum Thomas observed that industrial metal PMIs are starting to roll over, even though readings are still strongly positive.
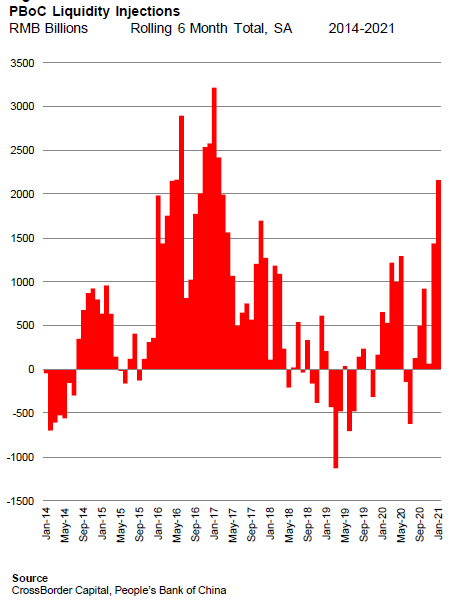
However, any pause in the cyclical rebound is likely to be short-lived. China has been leading the global recovery. Despite the recent pause, the PBoC has injecting liquidity into the financial system, which should boost the cyclical sector within the next few months.
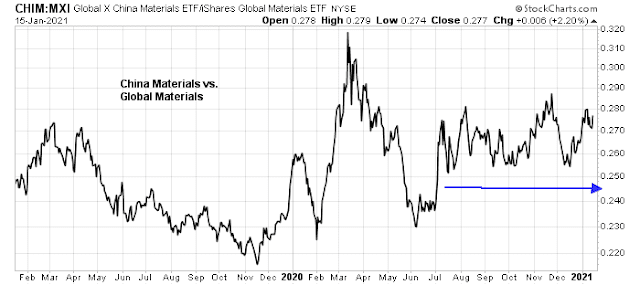
I am monitoring the relative performance of Chinese material stocks. This sector has traded sideways relative to other global material companies. While this is a sign that economic momentum is losing some steam, it will also provide a real-time alert of improving economic momentum from China.
Investment implications
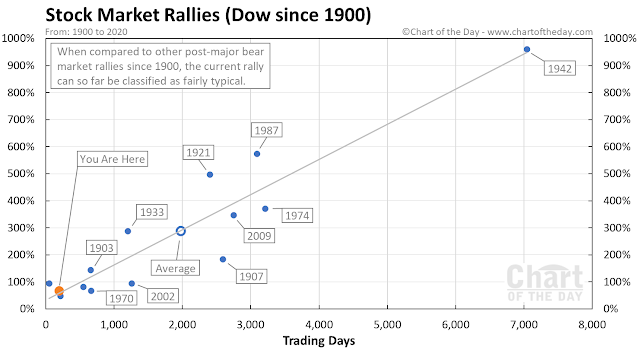
What does this mean for the stock market? First, investors should relax. The rally is likely due for a pause but the bull cycle remains intact. The current advance in the Dow is consistent with past historical experience since 1900.
From a sector perspective, investors should focus on value stocks. The relative performance recovery of large and small cap value, however they are measured, are intact.
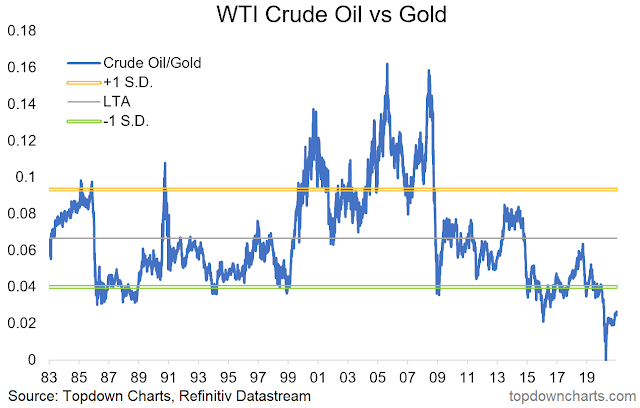
In particular, the energy sector holds promise. This sector has become the smallest sector by weight in the S&P 500, indicating its unloved status. Even within the commodity sector, the crude oil to gold ratio is depressed. Energy stocks are now the new tobacco – unloved value stocks. Their recent relative strength recovery could be a signal of a turnaround for this sector.
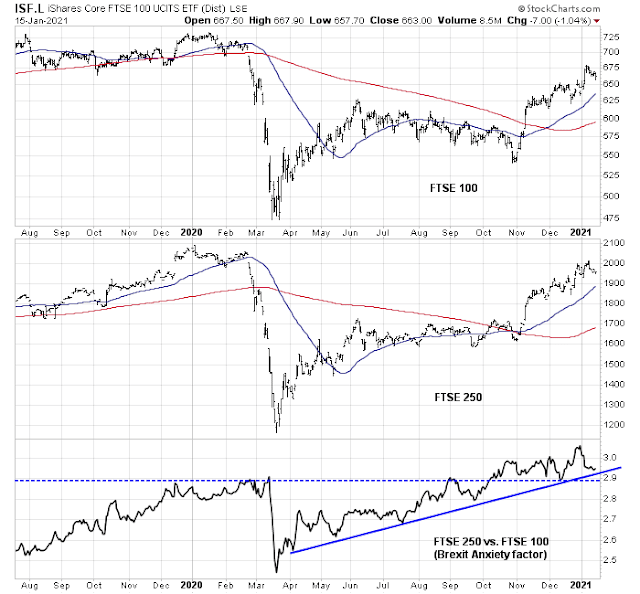
From a global perspective, investors can also consider value candidates that have begun to recover. In the developed markets, small cap UK stocks could be a source of outperformance, now that the uncertainties of Brexit have been resolved.
Within the emerging markets, EM xChina has been exhibiting strong relative strength, though it is a little extended and could see a short-term pullback.
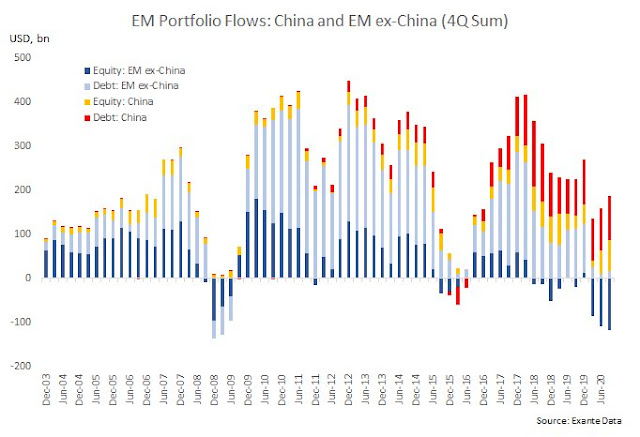
However, the analysis of fund flows show that EM xChina equity flows are net negative for 2020. These stocks are still under-owned, indicating substantial potential for outperformance.

Fragility is an important concept when it comes to sectors. That is when a given group tends to drop more than others when markets fall. The worst and most fragile in that regard is energy. On a rolling six month basis, it has been deeply negative most of the time for years and yet at every market rally it is a leader going up 30-50% in the month or two after a low. But then it collapses even more and the six month rate of change stays down.
Since Cam is expecting a pullback, energy would be my last choice. If Energy on the next dip is not fragile for the first time in a couple of years, then I would rethink its investment qualities.
I made a mistake in owning China in 2010-2012 when its economy was so much stronger that the world’s but their stock market lagged badly. The same thing is happening now.
They are raising interest rates and cracking down on highly leveraged corporations including state-owned. Amazing that they are following Keynesian policies of stimulating when needed and then withdrawing the stimulus when the recovery is on. Central Bankers in the West just vary the easing from lots to insanely lots and then back to lots. They only pay heed to the stimulus part of Keynesian economics.
China therefore is a stable center for the Far East economically but their stock market will disappoint. That is why Emerging ex-China is outperforming Emerging with China. All of the emerging economies are being fed by exports to the growing economic rebounds of large economies (China and the Developed world) as they benefit from low interest rates and a weak US dollar.
When considering the MCSI EM worth noting that China, S Korea, Taiwan make up two thirds of it by value, and that if they were excluded the index would be down last 12 months, not up 20%!
I measure the current momentum from the November 9, Vaccine Day. S Korea is a huge winner, Taiwan outperforms and China lags. With EM ex China we get the best two out of three.
Just one caveat: EM and especially EM xChina is vulnerable to a counter trend USD rally.
Cam, if there is a countertrend USD rally for a short period, it will hurt commodities and cyclicals.
Could money flow into the large-cap Growth / FANG-type stocks for a short period?
Also, what will drive this countertrend USD rally?
1. USD countertrend rally is due to rebalance of one-sided future bets.
2. I think it is a better practice to approach EM thru individual stocks, instead of indices. Using simple set theories: MELI (overlap of EM and e-comm), TSM (overlap of EM and semiconductors), and others. USD fluctuations have no impact on them. They are secular high growth co’s.
3. Big-cap techs are consolidating for quite a while now. This is the group who is ready to run, if the money rotates back. We will soon find out during this earnings season. Just to hedge, if they don’t run, then we know market will be likely to correct.
=> Just to hedge, if they don’t run, then we know market will be likely to correct.
Good thinking. I also like SE as an EM play.
Thanks for your comment.
I’m in agreement re the large-cap technology stocks. Nothing in the markets moves in a straight line, and it feels as if the FAANG stocks are ready to make at least one more run at all-time highs. I’m not ready to write them off.
We are starting to see the counter-trend rally now. The USD Index has rallied through a short-term downtrend.
This is likely going to resolve with a brief corrective/risk-off episode of several weeks. FANG+ stocks would outperform under those circumstances, but don’t expect them to give you positive returns.
Thank you, Cam. Sounds reasonable.
The unsung hero is RETL (?)
Amidst the recent news of HP/ Oracle/ Tesla relocating their respective company HQs to Texas (Ellison himself will be relocating to the island of Lanai), there are signs that interest in commercial real estate is returning.
https://www.record-bee.com/2021/01/09/real-estate-office-property-deal-extends-palo-alto-hot-streak/
Alibaba is beginning to expand its presence in Silicon Valley, although the global shutdown has slowed things down.
https://www.mercurynews.com/2019/01/25/alibaba-arranges-big-lease-for-silicon-valley-outpost-in-sunnyvale/
Old companies move out, new companies move in.
I had to reconsider this comment a few times, as it sounds over the top – but I think it reflects just how much the stock market playing field has changed since the global shutdown. I haven’t independently verified the story, but the source (one of my wife’s nephews and someone I’ve never known to exaggerate for the sake of a good story) is credible. This nephew is a college freshman, and began trading options last spring. His Dad lost his job during the pandemic, and to generate income he began trading the markets. They both signed up for an online options trading class ($50 a month). And they’ve both made a decent amount of money at it. The story involves a classmate of the nephew, who also began trading options around the same time, and was quite successful. He funded an account with a few thousand dollars. Asked to guess, I imagined he took it up to 100k (isn’t that what Hillary accomplished with or without help in the Eightes). No. 250k? Not even close. Come on – we’re talking about an 18-year-old kid. So the punch line is $7 million, trading options mainly on TSLA.
You know, I think there are some very smart ‘kids’ out there who are doing quite well without the knowledge that most of us have accumulated over a lifetime of experience. How exactly have they changed the playing field? I’m still working that out.
It was Cramer who commended the Robinhood crowd last year – for buying aggressively into the March bear and then confidently betting on a recovery.
If we’re waiting for these kids to get their comeuppance – I think that’s misguided. They undoubted have a few lessons to learn – but just as importantly, they have a few things to teach us.
‘Clinton made her money by betting mostly on a market downturn at a time when cattle prices actually doubled…The editor of the Journal of Futures Markets said in April 1994, “This is like buying ice skates one day and entering the Olympics a day later. She took some extraordinary risks.”…One analysis performed by Auburn University and published in the Journal of Economics and Finance claimed to find that the odds of a return as large as Clinton obtained during the period in question were about one in 31 trillion.’
https://en.wikipedia.org/wiki/Hillary_Clinton_cattle_futures_controversy
Someone will always get lucky. With options the leverage is great but if the timing is off it’s really nasty. The volatility made those who were lucky do great…we hear about them, we don’t hear so much about those who don’t do great.
Cam said, “From a sector perspective, investors should focus on value stocks. The relative performance recovery of large and small cap value, however they are measured, are intact.”
What would be an example of a value small cap stock/ETF? Also same question for UK small cap.
Thanks