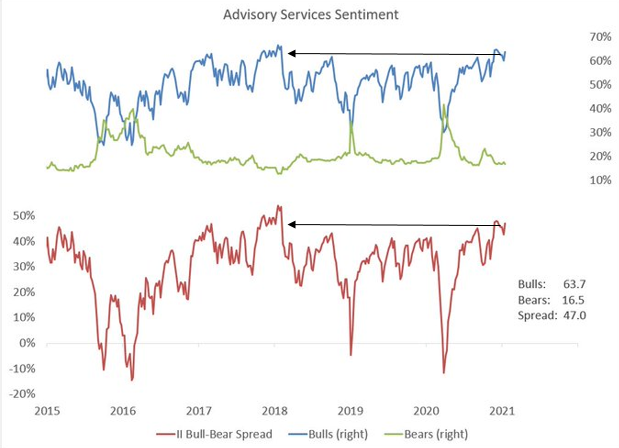
Mid-week market update: I have been warning about the extended nature of this stock market for several weeks. The latest II sentiment update shows more of the same. Bullish sentiment has come off the boil, but readings are reminiscent of the conditions seen during the melt-up top that ended in early 2018.
The market can correct at any time, but I also have to allow for the possibility of one last bullish push to fresh highs. Here is what I am watching.
High levels of speculation
I have written about how low quality stocks have begun to dominate the market. Here is another data point that details the level of speculative activity – the low price factor. On a YTD basis, low priced stocks have outperformed on a monotonic basis.

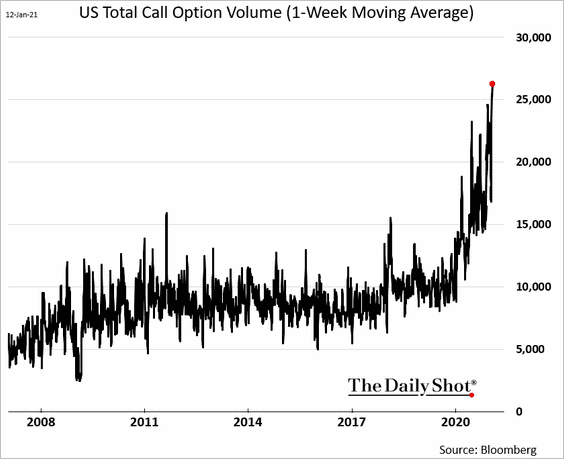
Similarly, option call volume has skyrocketed, indicating rampant speculative activity.
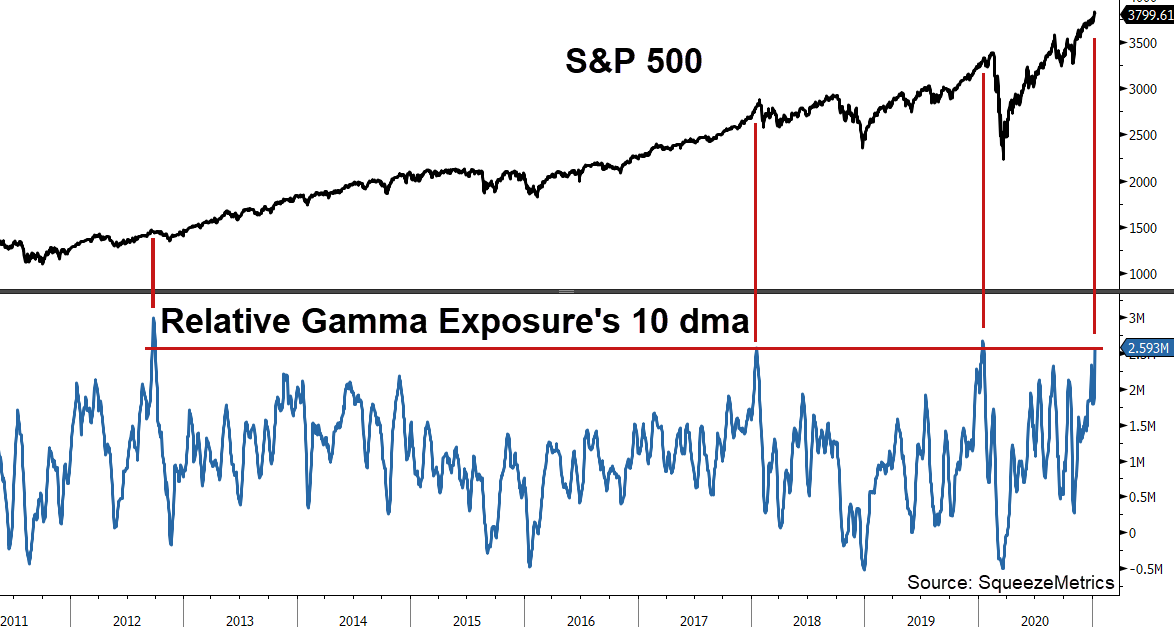
Consequently, dealer gamma exposure is also sky high, as dealers need to hedge the unprecedented levels of call option activity. Historically, such high levels of gamma have resolved themselves with corrective activity.
Another risk is the low short interest by historically standards. These levels will not provide the buying demand to put a floor on stock prices if the market corrects.

Waiting for the trading signal
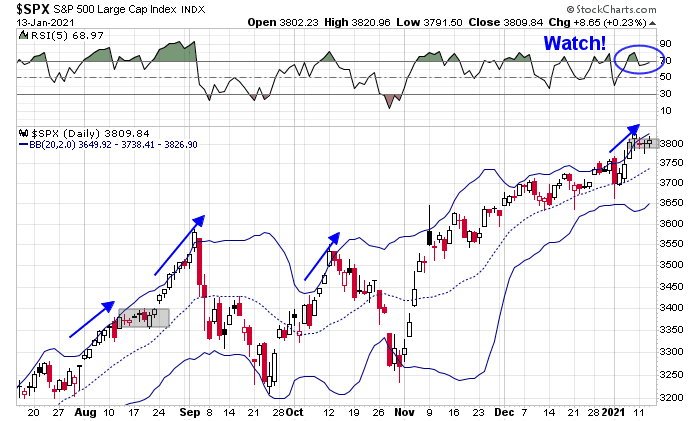
Before turning overly bearish, here is what my inner trader is watching. The S&P 500 recently went on an upper Bollinger Band (BB) ride. Such upper BB rides have either resolved with sideways consolidation and a renewed rally, as the market did in August, or a correction. So far, the market has traded sideways for several days, and he is now waiting for either an upside or downside break out of the trading range (shaded box). Should it break upwards, watch for signs of either confirmation of strength or a negative divergence from the 5-day RSI.
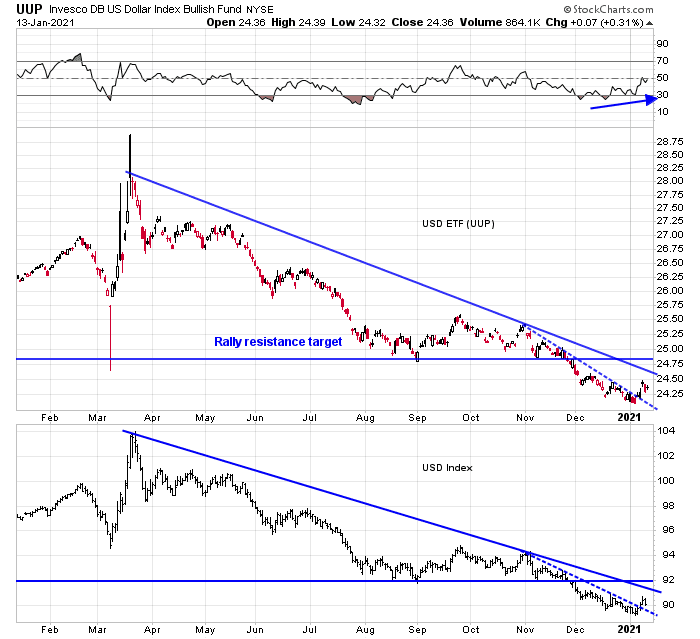
As well, keep an eye on the USD Index. The USD is important as a risk appetite indictor. A falling USD is helpful to fragile EM economies. As well, a rising USD can be a risk-off indicator because investors stampede into the greenback during period of fear.
The USD bottomed in late December and early January while exhibiting a positive RSI divergence. A countertrend rally appears to be underway as the index broke up through a minor downtrend (dotted line), but the major downtrend (solid line) remains intact. Watch for resistance at 91, and further major resistance at 92. (I show UUP, the USD ETF, because the USD Index data update is delayed on StockCharts).
My inner investor remains overweighted in equities, but he has reduced risk by tactically selling covered call options against selected long positions. My inner trader is on the sidelines, and he is waiting for a bearish signal to make a commitment to the short side.
Taking trades each day where I can find ’em.
100% cash as of last night.
Reopening a position in ASHR premarket ~42.6x, as it’s now down -2.5% since Tuesday and back to last Friday’s levels.
GDX/ PFE/ GILD-> I took losses on all three yesterday, which is generally how I manage trades that move against me for longer than a day or two. I think all three take off soon – but I need to adjust to the market’s timing.
QS.
FCEL.
FCEL off here for +5%.
Reopening a position in FCEL.
Trimming back here.
PEIX.
Trimming PEIX.
I think traders are anticipating Biden’s announcement of add’l stimulus.
I’m seeing a ton of headlines along the lines of ‘How much juice is left?’
That’s highly bullish from a contrarian point of view.
Call it a gut feeling.
Opening positions in VT/ RYSPX here. I think we break out to the upside today. VT is the safer play if I’m wrong.
I’ve been burned in the past playing upside breakouts in the market using sector ETFs. That’s trying to be too cute and sometimes we get punished with a red P/L despite the bull wave.
BTBT.
I plan to add a second tranche to both VT/ RYSPX near/at the close.
My take here is that the market will always try to fake you out (perhaps take you out is more appropriate) before making its move.
There’s no way to really know until it happens. JMO.
TLT-> looks like a one-day trade was all it was!
Reopening a position in COTY.
The negative close gives me a better basis on the index positions.
I may be totally off, but it feels like the closing selloff succeeded in (i) discouraging anyone who wanted to play a Thursday rally and/or (ii) convincing fence-sitters to remain where they are.
Might also be the inauguration next week.
Right. My thoughts:
(a) Whether it’s $1400 payments or $2000 payments won’t matter. It’s the fact that Democrats will continue to do whatever it takes. As was the case last time, many people will funnel the payments into the capital markets.
(b) It’s possible we sell off hard from all-time highs – but the kind of momentum we’ve seen recently dies hard. More likely to see one or more warning shots across the bow, which gives us time to adjust exposure.
Now that we have a ‘sell the news’ reaction, I’m ready to add a few sector ETFs->starter positions in XLE/ XLI/ XLF/ EEM.
Adding XME.
Adding EFV.
Adding JETS.
Downdraft continues. I’m going to hold the line on further purchases unless/until we see sustained support kicking in.
SPX has broken 3750. Starting to reduce risk here. No second guesses.
Pared back from 30% to 25% exposure. No doubt I unloaded a few positions at the intraday lows, but that’s the way it goes.
My goal (if possible) is to preserve at least ytd gains through last Friday.
If that fails, then IMO it’s a real shot across the bow that calls for a move to defense.
SPX 3750 appears to have triggered a wave of risk reduction.
The positive scenario would be an undercut of the overnight low in the ES followed by a recovery.
The negative scenario would be an intraday retest that fails.
Plan A is the optimistic outlook – ie, today’s selloff resets sentiment sufficiently to support a continuation the 2021 rally next week.
Plan B? A closing selloff that eclipses the morning lows.
Beginning to add back a few positions on strength here. This requires a degree of faith in Plan A. I’m placing stops on all new positions.
My thinking at this point comes down to:
(a) Between the -500-point selloff on Monday and the -380-point decline today, we have sufficiently reset sentiment for a continuation of the 2021 rally.
(b) Another perspective – the intraday low for the DJIA (if it holds) may be seen as a successful retest (higher low) of the 1/4 low.
Starting to see a few green shoots on positions opened this morning.
wow
double wow
Today’s pullback is a major plus, IMO. Overdue and maybe a great setup for a post-inauguration rally that lasts the rest of January.
Tough call in the last 15 minutes. I’m sticking with all positions.