Mid-week market update: In light of Monday`s Zweig Breadth Thrust signal, I thought I would do one of my periodic sector reviews to analyze both sector leadership and the implications for stock market direction.
As a reminder, Relative Rotation Graphs, or RRG charts, are a way of depicting the changes in leadership in different groups, such as sectors, countries or regions, or market factors. The charts are organized into four quadrants. The typical group rotation pattern occurs in a clockwise fashion. Leading groups (top right) deteriorate to weakening groups (bottom right), which then rotates to lagging groups (bottom left), which changes to improving groups (top left), and finally completes the cycle by improving to leading groups (top right) again.
A review of the latest RRG chart shows a market in a bottoming process, with defensive sector leadership starting to roll over, and selected high beta and cyclically sensitive sectors becoming the emerging market leaders. While defensive sectors such as the Consumer Staples, Healthcare, REITs, and Utilities, are in the leading quadrant, they are losing relative strength. By contrast, Communication Services, led by selected FAANG stocks and high beta names, and Materials appear to be poised to become the next market leaders.

The ZBT signal clarifications
I have had a million questions about the recent ZBT buy signal (see A rare “what’s my credit card limit” buy signal). Many questions and comments revolved around distinguishing the short and intermediate term outlooks after such signals.
Rob Hanna of Quantiable Edges documented the past forward 20-day performance of such signals. From this table I can make a number of observations. These signals are rare, they often occurred at major market bottoms, and all were profitable after 20 trading days.

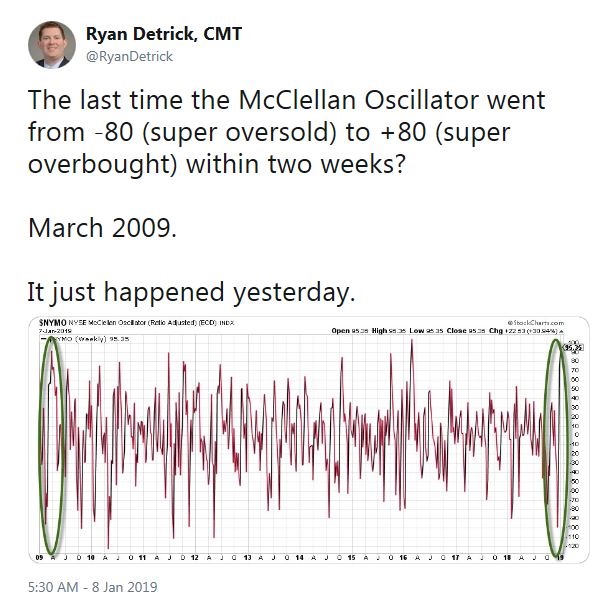
The ZBT is a burst of price momentum in a short period that moves from deeply oversold to deeply overbought. Ryan Detrick observed that the McClellan Oscillator (NYMO) went from super oversold to super overbought within two weeks. The last time this happened was the market bottom in March 2009.
I observed in my post (see A rare “what’s my credit card limit” buy signal) that the market often paused and consolidated its gains for about 2-3 after the ZBT signal. Urban Carmel also found that similar NYMO breadth thrusts saw short-term pullbacks and consolidations, though they ultimately resolved themselves bullishly.

In short, ZBT buy signals are very rare, and they tend to mark major market bottoms. While the one to 12 month track record has shown positive gains, expect a brief pullback and consolidation to digest the gains after the signal. Any weakness should be interpreted by traders as an opportunity to buy.
A high beta revive
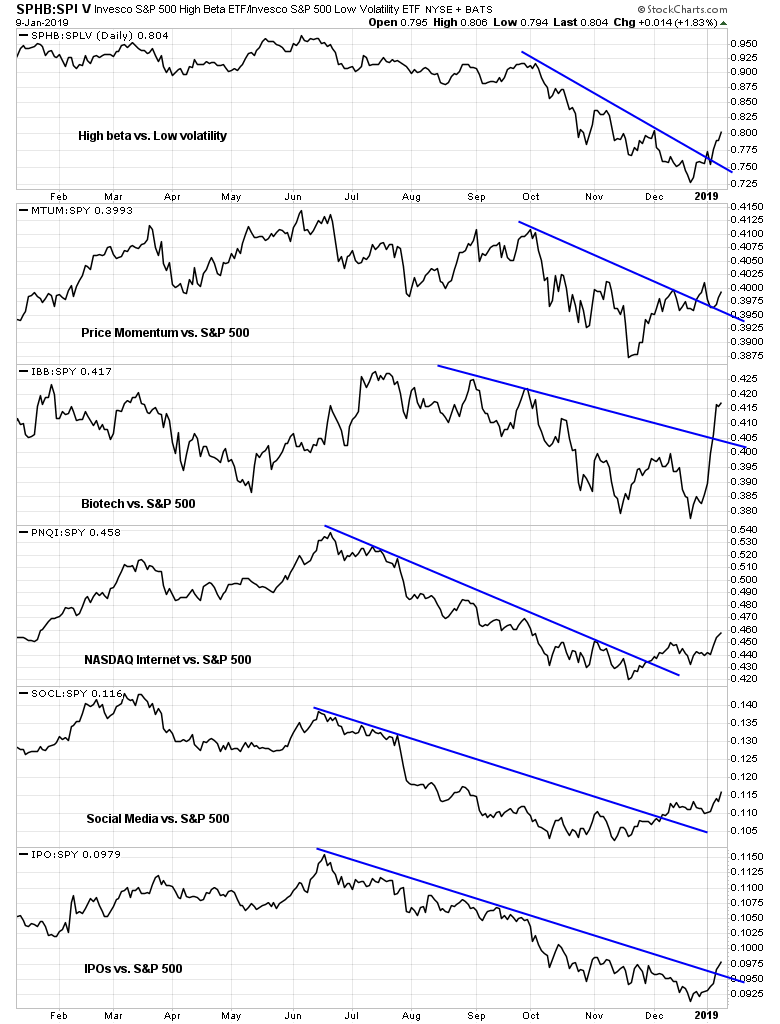
When I view the market through a sector and market internals prism, high beta groups are starting to revive. The chart below of the market relative performance of different high beta groups, from high beta to low volatility, to NASDAQ internet, and IPO stocks, all show bottoming patterns. These groups have rallied through relative downtrends and they are in the process of making broad based saucer shaped relative bottoms.
Investors looking for emerging market leaders might consider Communication Services.

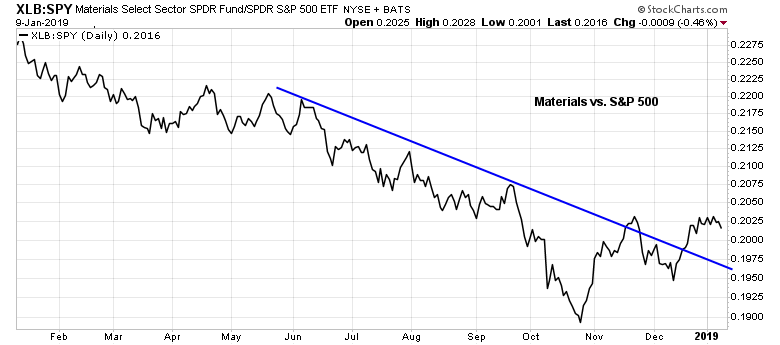
As well, the cyclically sensitive Materials sector may also serve as useful diversification to the high-octane FAANG names contained in Communications Services.
In conclusion, sector rotation analysis reveals a market that is undergoing a bottoming process. Defensive sectors are rolling over in relative strength, and selected high beta groups are becoming the emerging market leadership.
My inner investor is drawing up a buy list of names, and he plans to re-balance his portfolio from underweight to market weight equities. My inner trader went long on Monday at the ZBT buy signal, and he plans to add to his positions on any pullback.
Disclosure: Long SPXL
I’m a bit confused.
Just a few days ago on the 6th Jan you reminded us that Quote
“It gives me little pleasure to say “I told you so”. But I told you so.” because “Winter is Coming” with a poor earnings season coming up. But in just a few days “The Animal Spirits are stirring”.
Can things really turn around that quickly ?
Have the “Ultimate market timing model “ or “Trend Model signal” signals changed ? Thanks.
The combination of the ZBT and subsequent assessment of macro conditions and valuation made me change my mind. I had outlined the downside risks on the weekend, but it seems that those risks are receding, which makes for greater upside potential.
I continue to believe that the next few months will remain choppy as those risks resolve themselves. We will get ups and downs during earnings season, ditto for news on the US-China trade negotiations, and so on.
Thanks for having the conviction and the flexibility to change your mind when the facts changed.
Cam, How does this reconcile with you expecting the Fed to raise interest rate again in March? Won’t that dampen the spirits if not entirely kill it as the market is NOT expecting the Fed to raise interest rate? We still need to have an agreeable resolution to trade war with China. Assuming a Fed pause and somewhat amicable resolution trade war, shouldn’t we invest in US Homebuilders, Chinese BAT and EEM given they lost the most and therefore have the most to gain?
I said that the ZBT signal does not preclude a later correction to test the previous lows. If the Fed were to turn more hawkish, that may be the catalyst for a re-test.
That clarifies. Thanks much, Cam.
US Small cap and EM are showing relative strength too… Good signals along with momentum and high beta sectors. But wouldn’t go full-scale just yet. Pullback needed IMO. Thx Cam
ITB breaks out today. It is the first to collapse Jan 2018.
EEM is very close to breakout. It also collapsed about the same time as ITB did.
Confirmation of completion of bottoming should be when SOX breaks out. It started to drop Mar 2018. It cleared 50DMA today.
All three have 20 and 50 DMA start to turn up. It is early. The primary trend is still down. Things can still turn ugly.
In the Dec. 30 weekend blog, three trading days after the December 24th low, I posted that we had hit an important low. I was already shifting client portfolios from extreme underweight equities to normal weight starting on the 24th, the day of the low.
The rare Beta Crash Bear market had ended. This is the type of bear that doesn’t need a recession. It’s simply a bear caused by the stock market getting too high due to investor extreme optimism. Previous cases were 1987 and 2011.
Entering 2018, the investing world outlook was perfect and stocks went too high, dangerously high because of it. Stocks are safe when investors are in panic mode like December. That is a truth that recurs cycle after cycle. Been there, seen that. As I mentioned in the Dec. 30 post, when the Low Beta Index falls 10% in a month (an extremely rare occurrence), after the Hi Beta has already fallen dramatically, the Hi Beta (and the general stock market) bottoms. It’s the final nail in the coffin for the bear, the panic hits the defensive stocks. Put that in your kit bag for the next Hi Beta Bear.
The big question from a cyclical point of view is whether we will morph into a standard recessionary bear. It’s my belief that the Dot.com, year 2000 bear market started as a Hi Beta Bear and then the economy hit the skids after to extend it into a Recessionary Bear.
Going into the fourth quarter, the rising interest rate outlook had us heading for a recession in 2020. Junk yield spreads started to blow out. But now the Fed Funds Futures have plunged and the high yield spreads are contracting fast. The case for higher rates causing a recession in housing, autos and consumer spending in general are out the window. I’m monitoring Fed Futures and Junk spreads to confirm this continues. I will say David Rosenberg, a world recognized economist and friend of mine is very negative about the U.S. economy for a myriad of reasons. This is why I’m using stop-loss type tools (moving average trendlines and straight stop-loss orders) to provide an objective parachute in case an unexpected negative economic or political outcome occurs to send us into a Recessionary Bear. So I’m a chicken bull from December 24 on. No longer a confirmed bear. That was last year’s Ken.
Ken,
That was quite the call on your part in December. Kudos!! I think the issues, at least for this qtr are what happens with P/E, Earnings, Brexit, Trade war, Emergency for the Wall etc. Also, I think market is very tied to the whims of the News cycle right now. We gotta wait and see, hopefully the other leg down, and then when, as Cam says, “Bad news stops having it’s effect on the market”.
But once again, Great call!!!
Keep up the good work. And thanks for your perspective.
Can you please clarify why is the selection of ZBT signals different between the table from Quantifiable Edges and your chart of ZBTs in the past 20 years in the previous post? Is it that the ZBTs in the table are based on SPX and the ones in your chart on NYSE? If so, does it make sense to have such different results from two indices that should behave similarly?
Hi Cam,
Now that the ZBT signal is in, and the leading economic indicators never really signaled recession, is your Ultimate long term Model still bearish?
Hi Cam,
In light of the ZBT and apparent bottoming of the market, what do you make of Gold and Gold Stocks holding up quite well in this environment? Do you see higher prices ahead for both?
Gold has been the negative beta and safety play. Now that stocks are turning up, gold prices are likely to face headwinds.
Mark Hulbert also found excessive bullishness on gold, which is contrarian bearish.
https://www.marketwatch.com/story/the-bull-trade-in-gold-has-become-uncomfortably-crowded-2019-01-11
That’s enlightening, thanks a lot Cam.