Preface: Explaining our market timing models
We maintain several market timing models, each with differing time horizons. The “
Ultimate Market Timing Model” is a long-term market timing model based on the research outlined in our post,
Building the ultimate market timing model. This model tends to generate only a handful of signals each decade.
The
Trend Asset Allocation Model is an asset allocation model that applies trend-following principles based on the inputs of global stock and commodity prices. This model has a shorter time horizon and tends to turn over about 4-6 times a year. The performance and full details of a model portfolio based on the out-of-sample signals of the Trend Model can be found
here.
My inner trader uses a
trading model, which is a blend of price momentum (is the Trend Model becoming more bullish, or bearish?) and overbought/oversold extremes (don’t buy if the trend is overbought, and vice versa). Subscribers receive real-time alerts of model changes, and a hypothetical trading record of the email alerts is updated weekly
here. The hypothetical trading record of the trading model of the real-time alerts that began in March 2016 is shown below.
The latest signals of each model are as follows:
- Ultimate market timing model: Buy equities (Last changed from “sell” on 28-Jul-2023)
- Trend Model signal: Bullish (Last changed from “neutral” on 28-Jul-2023)
- Trading model: Bullish (Last changed from “neutral” on 22-Sep-2023)
Update schedule: I generally update model readings on my site on weekends. I am also on X/Twitter at @humblestudent. Subscribers receive real-time alerts of trading model changes, and a hypothetical trading record of those email alerts is shown here.
Subscribers can access the latest signal in real time here.
How much downside risk from here?
The recent downdraft in stock prices left many indicators in severely oversold territory. But how oversold, as oversold markets have been known to fall further. I compare the current technical conditions to the market bottom of October 2022.
Consider, for example, the Zweig Breadth Thrust Indicator. The ZBT buy signal is triggered when the ZBT Indicator moves from oversold to overbought within 10 trading days, which is a rare display of price momentum. Nevertheless, investors can use the ZBT Indicator as a short-term trading signal to spot entry points on the long side. As the accompanying chart shows, oversold conditions on this indicator always resolved in a short-term bounce, with no guarantee of a sustainable rally. The market did become oversold on this indicator last week, but levels were not as severe as the October bottom. In fact, the October bottom was a complex bottom, with the market becoming initially oversold, rallied, fell to another oversold condition, rallied again and weakened to the final bottom. The bottom was signaled by a positive divergence in the ZBT Indicator. None of that is in evidence today.

If we were to define the October low readings as the floor, does that mean the market has more downside potential?
Sufficiently oversold?
Here is what I am watching. Our Bottom Spotting Model is made up of five components. Historically, any two components that are triggered have been enough to signal tradable bottoms.
- The VIX Index spikes above its upper Bollinger Band;
- The term structure of the VIX inverts, as measured by the ratio of the 3-month to 1-month VIX;
- The NYSE McClellan Oscillator falls below -50, an oversold condition;
- TRIN spikes above 2, which indicates price-insensitive selling, or a “margin clerk market”; and
- The intermediate-term overbought/oversold model, which is the ratio of the percentage of stocks above their 50 dma to percentage above their 150 dma, falls below 0.5, which is an oversold condition.
All five components flashed buy signals during the October bottom, but only three have triggered buy signals today.
Take how sentiment models are behaving. The AAII bull-bear spread is -13 today, compared to -40 at the height of the October low panic. AAII bears spiked to as high as 60 in October, compared to 41 today.
On the other hand, the current 10 dma of the equity put/call ratio is comparable to the levels seen at the October lows, though readings did spike in December.
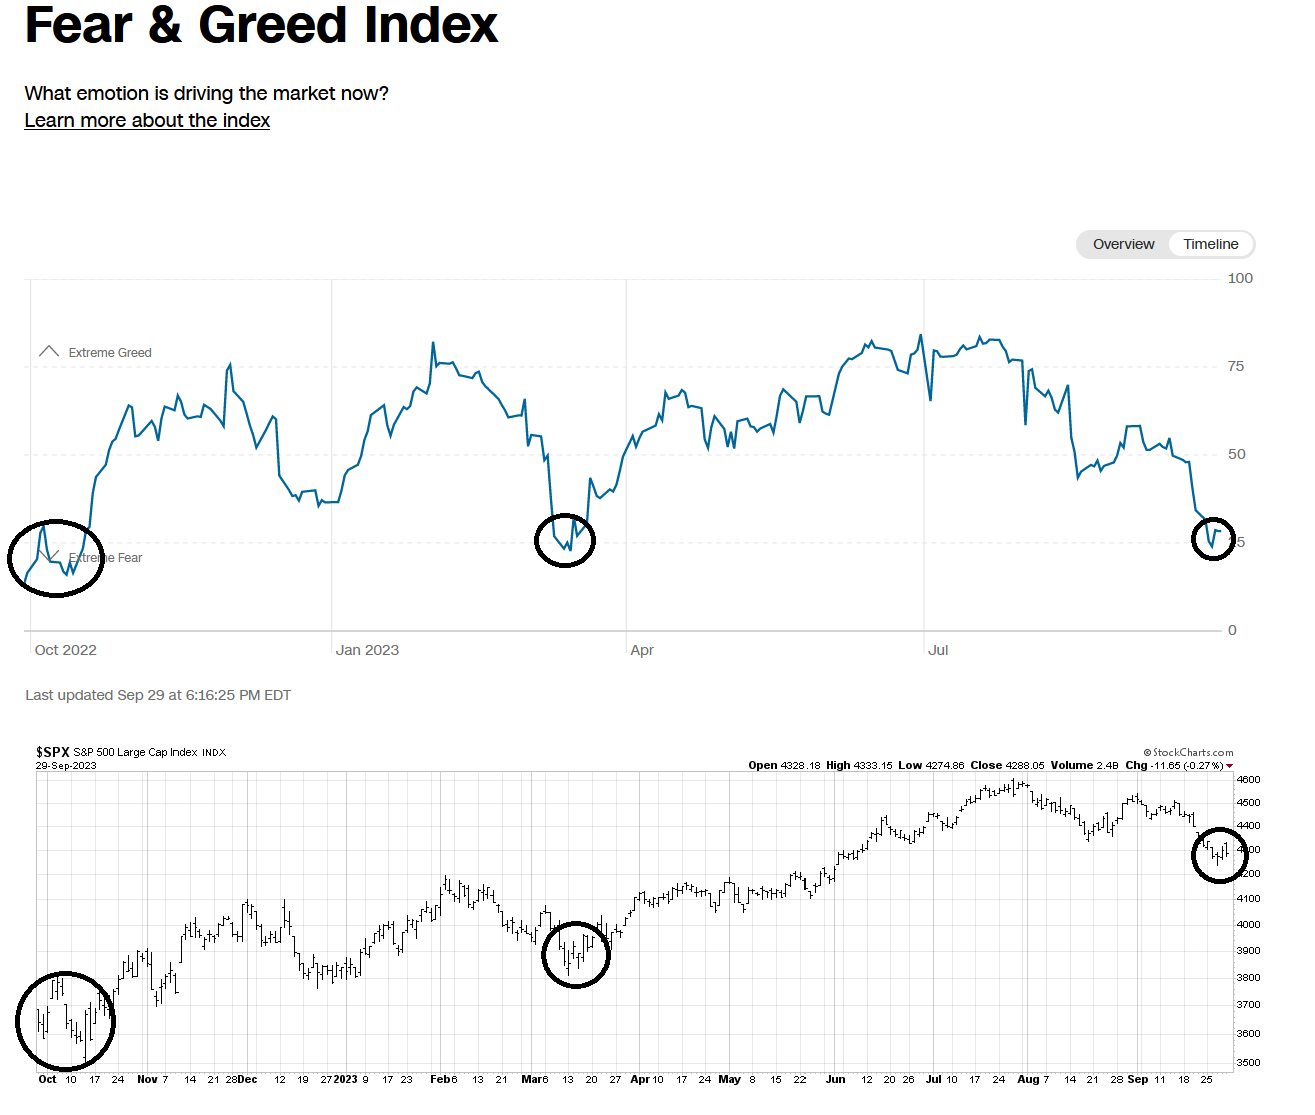
The CNN Fear & Greed Index is also at similar levels as the October 2022 bottom and tactical bottom in March 2023.
I am also seeing similar insider buying activity today as in October. While insider purchases (blue line) are exceeding sales (red line) in both instances, I prefer to see spikes in insider buying, rather than falling insider sales as a more convincing trading signal. Nevertheless, any past instances of purchases exceeding sales
A correction in an uptrend
Even though oversold readings are not severe as seen during the October low, the market is sufficiently washed out for a tradable relief rally. I interpret the difference in conditions as a correction in an uptrend, as illustrated by Investors Intelligence sentiment data. Willie Delwiche of Hi Mount Research observed that further deterioration in the II bull-bear spread would take sentiment into bear market territory. You need bulls to have a bull market.
Here’s another condition that leads to the belief that the latest episode of market weakness is just a correction and not the start of a major bearish episode. The relative performance of defensive sectors has been weak during this latest pullback. By comparison, the relative performance of these sectors was much strong in the downdraft that culminated in the October bottom.
As today’s technical and sentiment readings are consistent with a short-term bottom, current conditions appear to be a correction in an uptrend. Both investment-oriented and trading accounts should be bullishly positioned for an equity rally in the coming weeks and months.
My inner trader remains tactically long the S&P 500. The usual disclaimers apply to my trading positions.
I would like to add a note about the disclosure of my trading account after discussions with some readers. I disclose the direction of my trading exposure to indicate any potential conflicts. I use leveraged ETFs because the account is a tax-deferred account that does not allow margin trading and my degree of exposure is a relatively small percentage of the account. It emphatically does not represent an endorsement that you should follow my use of these products to trade their own account. Leverage ETFs have a known decay problem that don’t make the suitable for anything other than short-term trading. You have to determine and be responsible for your own risk tolerance and pain thresholds. Your own mileage will and should vary.


I like your bottom spotting indicators, I need to put them down on a chart for myself.
A caveat about oversold indicators is that oversold can become more oversold.
I was looking at a long term Finra chart of margin debt and SPX, going back to the 70s or 80s, and one thing stood out (besides the correlation of debt and SPX), and that was that debt has made higher lows after large corrections. So unless the bottom falls out, debt should rise. It makes sense that debt is down since rates are up so much, but it would be best to see debt rising in spite of “higher for longer”. Falling rates would most likely be a sign of trouble.
See this BoA margin debt model
https://twitter.com/sethcl/status/1706279144722448703?s=43&t=nQ-KOq5vF66pn-i1wqQBlA
I am very sure we will continue to have surprisingly strong US stock markets and economy over the next year. This is my longer-term confident call. Let me explain.
The number one most important event by far, is the 2024 Presidential election. Will Trump win? Many political thinkers including GOP old guard (that embrace the Constitution) believe a second Trump presidency will be a disaster for democracy and world politics. Regardless on where one stands on his economic policies, the consequences of a Trump victory would change world history on many non-economic fronts.
Therefore, I believe Democratic political strategists are putting together a sophisticated multi-faceted plan to make sure Biden wins. This is good news for the stock market.
Can politics effect the stock market? A resounding yes and I have the proof. Every Presidential cycle, I bring out an article from the 1980’s that I update every election. It shows that the fifteen month period from October 1, two years before the next Presidential election to January first of the election year has ALWAYS been up since the 1930s. The author said this must be due to the incumbent party in office making the economy look good for election year. In fact, amazingly, this 15 month positive action is almost all the upside of the 48 month election cycle.
Every update I’ve done has continued the winning streak and confirmed to me that politics is very much in action.
Look at the start of this cycle, last October first 2022. Go back in Cam’s archives back then and you will see me talking this up like I dd the four years before. Last year in October, Bloomberg came out and said there was a 100% probability of a severe recession coming soon. I decided to wait for the big, recession continuation of the bear market and didn’t jump in, to my regret. So I watched like anyone who understood how bad the macroeconomic environment was as markets soared without me bullishly positioned.
To NOT fall, stocks needed the US government to run an 6-8% deficit to GNP ratio (type needed during financial crisis) when the economy and employment were doing well. They had to overcome the Fed’s harsh inflation fighting policy (soaring rates). Fed was trying to reduce demand and the DEMs were hard on the economic gas pedal.
If the DEMs can overcome the extreme Fed actions keeping the economy and employment shockingly strong, they can do anything. And they WILL to save democracy, the Constitution and the democratic world.
There are DEM think tanks and experts mapping things month by month, week by week until the November 2024 election. It is that important.
Inflation will be falling over the next year. Good. Interest rates will peak and be coming down, Good. GOP in Congress will be allowed to show disfunction and inability to govern by DEMs negotiating hard on the budget to let them twist in the wind. Good for DEMs politically.
There will be many, many events that happen where the DEM reelection strategy will be very subtle. For example, the US (Biden) just announce a protection agreement with the Saudis and their much hated, U.S. journalist killing, Prince. Included was an understanding on oil production, the terms of which aren’t outlined.
I’m they will be asked to boost oil production at a politically opportune time to drop the gasoline price in America. That will help the mood of voters and help inflation fall. To get this political plum, the US agrees to help the Saudis set up nuclear energy plants with uranium processing (under US supervision until it isn’t). Roll that around in your brain, the Iranians and Saudis, (mortal enemies) having their uranium upgrading centrifuges spinning like mad. The Saudis are shifting from buddies with China and Iran back to America. They will be serving the Biden administration and off the “I want Trump back” bandwagon. The political price was high for America but helping keep Trump out of office is worth it.
There will be many subtle things happening supporting campaigns of the DEMs White House and majorities in both Houses.
So, I am VERY confident markets will be higher a year from now, surprising experts that focus on the Fed and previously reliable macroeconomic indicators. I predict the DEMs winning both houses and the presidency.
The short-term swings are why i subscribe to Cam’s great newsletter.
2025, post-election will be epic in a very different way.
If Trump were to win the disaster has already happened, we just don’t know it yet. It would mean that after the Jan 6 2021 circus that enough Americans want him as POTUS to vote him in. That in my opinion is the disaster. Had nobody showed up at the Nuremberg rallies would things have been different?
I just wonder if Kennedy gets the Democrat nomination.
You had me at “I believe Democratic political strategists are putting together a sophisticated multi-faceted plan to make sure Biden wins. ”
If Dems can do next year, shouldn’t do they do this in every election? Won’t they like to win every election?
I hope Biden doesn’t trip walking on the debate stage, or freezes like McConnell has done a few times.
You also forgot the bogeyman of yesteryears… the rate hikes to 5.25%. While inflation and interest rates may drift down in coming quarters, the impact of the rate hikes is yet to be felt in the economy. That doesn’t bode well for the incumbent. The Fed is totally oblivious and driving forward while looking back at the stale data.
If Dems really want to win, one thing they could have done would have been to ask Powell to put a stop to hikes a few months ago. The US economy cannot handle 7+% mortgage rates, 9% interest on auto loans, 25+% interest on credit cards on top of 25+% hike in the cost of groceries, rents and gasoline.
Just to be clear, this is not a political message. I used to vote Dem but prefer to call myself an independent these days. I’d vote for whoever has the interests of America and Americans. Sadly, that’s just hard to find in Washington.
The political price was high for America but helping keep Trump out of office is worth it.
Please keep these type of comments off this site.
I don’t even want to start to talk about politics in this country here. That’s not what I pay for on this site.
Thank you for your consideration.
Politics has important investment implications for investing. For example, last year on Oct. 1 we started the next Presidential Election cycle. I mentioned why it works to prove the point. (a talk about politics) and if anyone followed it would have been a big winner with investments. It’s the narrative around the concept.