Preface: Explaining our market timing models
We maintain several market timing models, each with differing time horizons. The “
Ultimate Market Timing Model” is a long-term market timing model based on the research outlined in our post,
Building the ultimate market timing model. This model tends to generate only a handful of signals each decade.
The
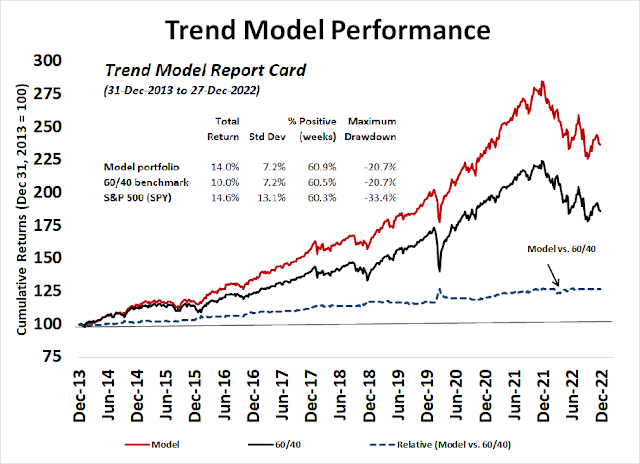
Trend Asset Allocation Model is an asset allocation model that applies trend-following principles based on the inputs of global stock and commodity prices. This model has a shorter time horizon and tends to turn over about 4-6 times a year. The performance and full details of a model portfolio based on the out-of-sample signals of the Trend Model can be found
here.
My inner trader uses a
trading model, which is a blend of price momentum (is the Trend Model becoming more bullish, or bearish?) and overbought/oversold extremes (don’t buy if the trend is overbought, and vice versa). Subscribers receive real-time alerts of model changes, and a hypothetical trading record of the email alerts is updated weekly
here. The hypothetical trading record of the trading model of the real-time alerts that began in March 2016 is shown below.
The latest signals of each model are as follows:
- Ultimate market timing model: Sell equities
- Trend Model signal: Neutral
- Trading model: Bearish
Update schedule: I generally update model readings on my site on weekends. I am also on Twitter at @humblestudent and on Mastodon at @humblestudent@toot.community. Subscribers receive real-time alerts of trading model changes, and a hypothetical trading record of those email alerts is shown here.
Subscribers can access the latest signal in real-time here.
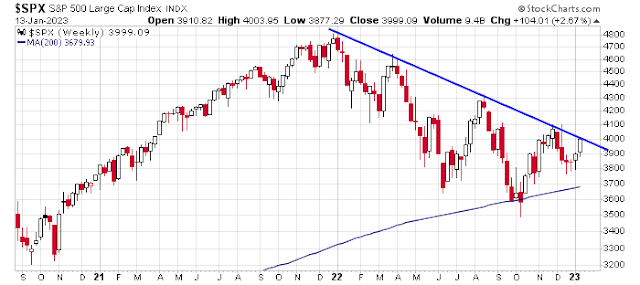
A test at trend resistance
The S&P 500 has rallied up to trend line resistance at about the 4000 level and it faces key tests.
Can the bulls stage a breakout? Here are the bull and bear cases.
Breadth thrust buy signals
Price momentum is flashing a buy signal again. Technical analyst Walter Deemer flagged a
“breakaway momentum” buy signal and a
Whaley Breadth Thrust which triggered last Thursday. If history is any guide, such circumstances have marked the start of new bull markets and continued equity strength.
That said, we have seen two previously “can’t miss” bullish momentum signals during this bear market. The percentage of S&P 500 stocks above their 50 dma recovered from below 10% to over 90% twice in the last year. Until 2022, past episodes have marked the start of fresh bulls. I am keeping an open mind, but I need to see more bullish follow-through before turning bullish.
Immediate failures of breadth thrust signals may be related to monetary conditions. There have been only six out-of-sample Zweig Breadth Thrust buy signals since Marty Zweig published his book that outlined his system. While the market was higher 12 months later in all cases, stock prices did not rise immediately in two instances during periods when the Fed was hiking rates.
Tactically, the market is exhibiting a series of overbought conditions. The S&P 500 has reached the top of its Bollinger Band. The VIX Index has reached the bottom of its Bollinger Band. The percentage of S&P 500 stocks above their 20 dma is above 80%. On one hand, these could be signs of a “good overbought” condition that kicks off a sustained rally, or they could be signs of bullish exhaustion.

For another perspective on the overbought and extended nature of the stock market, the Zweig Breadth Thrust Indicator reached a reading of 0.67 on Thursday, which is well above the 0.615 level necessary to mark the overbought condition for a breadth thrust. That said, the ZBT Indicator did not surge from oversold to overbought within the 10 day window necessary to register a buy signal. There were 11 occasions when the ZBT Indicator became this overbought in the last 20 years outside of ZBT buy signals (dotted blue lines). Of the 11 overbought conditions, the market pulled back in seven (pink lines) and continued to advance in four instances (grey lines).
A VVIX warning
One clue of how to resolve the bull and bear question comes from the VVIX Index, which is the volatility of the VIX. The S&P 500 and VVIX 5-day correlation spiked above 0.5 while the NYSE McClellan Oscillator is overbought, which is a tactical sell signal with a strong bearish bias.
Earnings season acid test
The acid test for the stock market will be Q4 earnings season, which is just starting. The bulk of S&P 500 earnings reporting in late January.
As we enter reporting season,
Gina Martin Adams of Bloomberg Intelligence observed that the consensus is calling for a shallow earnings recession to last until Q3 and sales growth to decelerate to nearly zero by mid-2023.
The risks are high.
Mark Hulbert argued that the elevated nature of operating margins and growth outlook makes the equity return outlook challenging.
Even if profit margins don’t decline further from current levels, it will be difficult for a bull market to gain much traction. If profit margins stay constant, for example, and there’s no change to the market’s P/E ratio, the stock market’s future return will be a function of revenue growth. And that in turn is dependent on economic growth.
That’s a sobering prospect. The non-partisan
Congressional Budget Office is projecting that nominal U.S. GDP will grow at a 4.6% annualized rate over the next decade. To translate that GDP growth rate into a projection for corporate revenue growth, we must subtract an estimate of the portion of GDP growth that does not come from publicly traded corporations—such as entrepreneurial startups, private equity, venture capital, and so forth. Following research from Robert Arnott, founder and chairman of Research Affiliates, I subtract 0.9 of an annualized percentage point. After also subtracting the CBO’s projection of CPI inflation over the next decade, we arrive at a projected real return of less than 1% annualized from now through 2032.
In other words, given these assumptions, the stock market over the next decade will barely keep up with inflation.

The S&P 500 is trading at a forward P/E of 17.3, which is elevated in light of recession risk and the recent trend of falling earnings estimates.
Moreover, FactSet pointed out that the market is undergoing a trend of falling earnings surprises, which is also indicative of deteriorating fundamentals.
The coming weeks will represent key tests for equities, both from technical and fundamental points of view. Subscribers received an email alert that my inner trader had initiated a short position in the S&P 500. Please be reminded about the usual disclaimers about my trading positions:
I would like to add a note about the disclosure of my trading account after discussions with some readers. I disclose the direction of my trading exposure to indicate any potential conflicts. I use leveraged ETFs because the account is a tax-deferred account that does not allow margin trading and my degree of exposure is a relatively small percentage of the account. It emphatically does not represent an endorsement that you should follow my use of these products to trade their own account. Leverage ETFs have a known decay problem that don’t make the suitable for anything other than short-term trading. You have to determine and be responsible for your own risk tolerance and pain thresholds. Your own mileage will and should vary.
Disclosure: Long SPXU


Cam
You had compared Wayne Whaley and ZBT signals in an earlier article. Neither of them are perfect, but both were good “signals” to catch bottoms, within say a 10% range is what I remember. Both indicators seem to produce buy signals close to each other, rather than simultaneously is what I remember. FWIW, we may be getting close to a flush out, with US debt ceiling fight approaching, earnings that are slated to decline and the Fed relentless in its pursuit of killing inflation.
Ken would know that one of the professional advisory services that is widely followed and he has referenced in the past, has eliminated their short (hedge) portfolio position from their portfolio, thereby increasing net long exposure from 38 to 50%.
Thanks for the follow-up on the thrust signals.
None if the previous failed thrusts had junk bond spreads falling, inflation falling, 2024 Fed Futures plunging, American dollar falling, gasoline prices falling, employment strong, Fed close to pausing, China reopening, Russia losing, and the Bengals coming back from 27 to 0 down.
My guess is onward and upward.
Someone asked how I calculate my TWISTs yesterday. I posted a reply that you can see there if you are interested. Witnessing a huge number of industry and country index TWISTs on November 10 led me to turn bullish calling Investing Winter over and new Spring (bull market) arriving.
These readings are consistent with your view that the US will be a laggard. Europe recovers first, we disagree on China, but it would be no surprise that the US lags and the S&P 500 re-tests its lows in the next few months.
Totally possible. The TWISTs in America and Canada failed immediately while Europe and China marched on strongly. Valuation of US Growth is still very out of line given the new levels of interest rates and hence their general indexes too.
Sorry, Jaguars comeback win.
https://twitter.com/WalterDeemer/status/1613905472188203008
“It takes unusually-powerful breadth over a ten-day period to generate Breakaway Momentum. Which means, by definition, the market is always overbought from a short-term standpoint when Breakaway Momentum is generated.”
https://twitter.com/aydako/status/1613950110014083090
During the 1st 6 weeks of the BAM, the avg pullback was 4.5%. During the 1st 3 months, the avg pullback was 5.6%.
So, looks like go with a short-term pullback now as Cam outlines and wait for a better LONG entry in weeks and months to come.
A pull back of 50% between 3600-4000 range is a possible, give or take 5%. A deeper pull back all the way to 3600 would be awesome entry point IMHO.
A pull back of 50% between 3600-4000 range is possible, give or take 5%. A deeper pull back all the way to 3600 would be awesome entry point IMHO.
https://twitter.com/WalterDeemer/status/1615384072125038592
“If this Breakaway Momentum thing still works, maybe the Big Contrary here is an up first half and a down second half.”
Finally, someone who agrees with me…