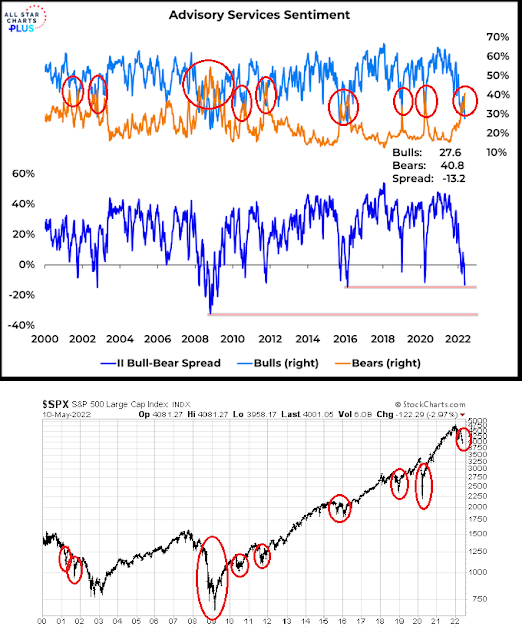
Mid-week market update: For several weeks, sentiment surveys such as AAII and Investors Intelligence have signaled extreme levels of bearishness seen at past market bottoms. However, some observers have played down the sentiment surveys because indications of positioning are inconsistent with extreme fear. As an example, funds are still pouring into the Cathie Wood’s Ark Investment ETFs even as the speculative growth vehicles tank. That’s not the sort of behavior seen at washout bottoms. On the other hand, I have received a flood of emails and other messages of concern about the stock market indicating growing fear and panic.
To resolve the dilemma, my
publication “How to spot a market bottom” published on March 19, 2022 offered a useful checklist that I’ll go through.
Market bottom checklist
The checklist consisted of:
- Insider activity;
- Market positioning in futures; and
- Oversold and breadth indicators.
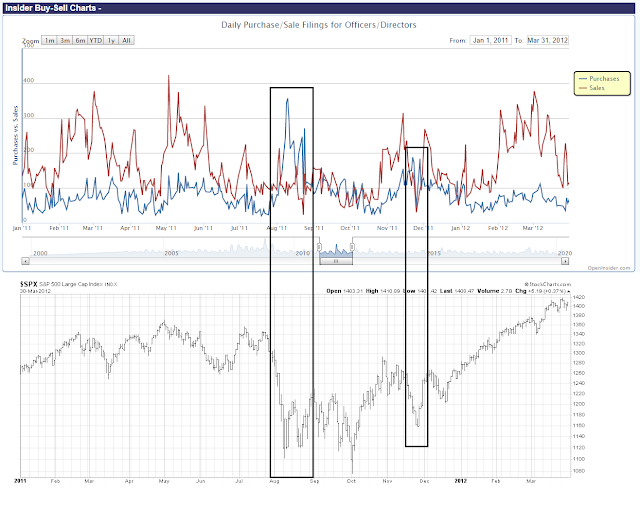
Let’s go through them, one at a time. Recent insider activity showed a brief flash of more buying (blue line) than selling (red line), which is constructive. We saw a similar episode during the short-term bottom in January.
As a reminder, insiders were buying hand over fist during the GFC market bottom.
We also saw clusters of much stronger insider buying during the Greek Crisis of 2011.
Insiders similarly stepped up their buying during the COVID Crash.
The takeaway from insider activity is these “smart investors” do not signal tactical trading bottoms, but intermediate and long-term market bottoms. While current activity is mildly constructive, we aren’t quite there yet.
Futures positioning
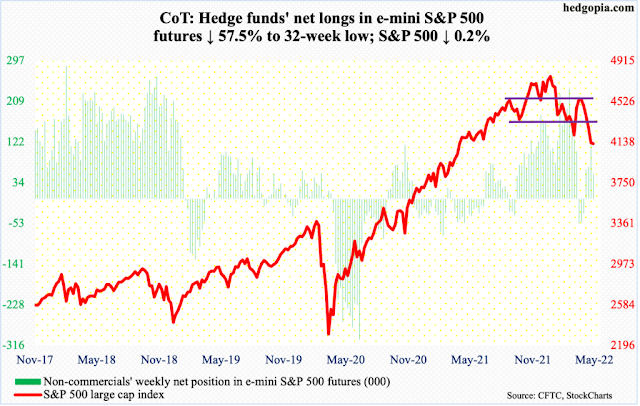
As for futures positioning, the latest Commitment of Traders report, which was published last Friday based on the data from the previous Tuesday (May 3, 2022) shows that large speculators held a minor long position in S&P 500 e-minis, but the momentum was negative. However, futures positioning have tended to lag major market bottoms owing to the lagging nature of trend following CTA programs.
The COT picture for the NASDAQ 100 futures shows a similar minor long position and historically lagging positioning signals.
Oversold enough?
From a technical perspective, the good news is one of the main technical indicators shows that the market has reached the minimum threshold for an intermediate bottom.
I have highlighted the “good overbought” advance from the March 2020 bottom before. This was evidenced by the percentage of S&P 500 stocks above their 200 dma rising to 90% and remaining there. The overbought condition recycled in mid-2021 (top panel). Historically, such declines don’t end until the percentage of stocks above their 50 dma fall below 20% (bottom panel).
The percentage of S&P 500 stocks below their 50 dma fell below 20%, which is the minimum criteria for a bottom. At this point, investors have to make a decision as to whether the current market downdraft represents a minor pullback or a major bear market. If it’s a minor downdraft, the bottom is in. In a major bear market, this indicator has fallen to as low as 5%, though the current sub-20% reading could be a setup for a relief rally, followed by further losses.
The NYSE McClellan Summation Index (NYSI) has signaled major market bottoms when it fell to -1000 or less. The NYSI is far from that reading, but the market has bottomed at current levels in 2011 and 2015-16.
Other breadth indicators which weren’t part of the checklist are sufficiently oversold to signal a possible bottom.
A rally within a downtrend
I interpret these conditions as the market is setting up for an imminent relief rally within the context of an intermediate downtrend. I recently pointed out that S&P 500 valuations are not attractive enough for a major market bottom (see
Profit opportunities in the coming global recession).
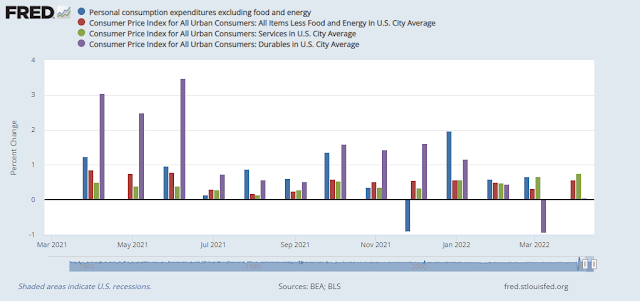
On the other hand, I was surprised that the stock market didn’t immediately tank on the hot April CPI report this morning. While core PCE and core CPI are decelerating, the pace of deceleration is uneven. The long-awaited decline in durable goods CPI is finally evident (see used cars), but services CPI is stubbornly strong, paced by an acceleration to a 0.5% MoM increase in heavyweight Owners Equivalent Rent from 0.4% the previous month, and an astounding 18.6% MoM rise in airfares. These conditions allows the Fed to stay on its hawkish tightening path, but stock prices didn’t immediately respond. By contrast, the 2-year Treasury yield rose, which is a proxy for the market’s estimate of the Fed Funds terminal rate, while longer dated Treasury yields fell, indicating the expectations of a slowing economy.
In the meantime, the NYSE McClellan Oscillator (NYMO) is oversold, where the vertical lines on the chart are buy signals when NYMO recycles from oversold to neutral.
The Zweig Breadth Thrust Indicator is also in oversold territory. Major bear legs simply don’t start in such extreme conditions.
My inner investor is cautiously positioned. My inner trader has a few nicks on his hands from trying to catch falling knives, but he is positioned for a counter trend rally.
Disclosure: Long SPXL


The way the market is trading – closing everyday at the bottom makes one wonder if we are setting up for a selling climax. In any case, in my book catching the exact day and time of “THE BOTTOM” is fairly irrelevant as in most cases it is tested again. That is how we see divergences. Most professional traders are happy being right 50 to 65% of the time. The odds of catching a bottom is less then 50%. Three bad trades in a row without using stops and you are out business. The trend is your friend. Unfortunately, the trend. One can go long XLE it is up 40.23% YTD!
Sorry. Unfortunately, the trend is down.
Maybe I am interpreting that differently, but after the CPI reading, the futures did tank and USD rose immediately within the narrative of a runaway inflation: S&P 500 -2.13%, NASDAQ 100 -3.05%, EURUSD -0.48%, USDJPY +0.70%, 10y T-Note -0.80%, respectively at the peak.
It reversed after the initial reaction, at least for a few hours, but it was not yet indicative of a good-reading-good nor bad-reading-good market psychology, which has always been there since 2009 GFC but not this year.
Please be super cautious. There is a good chance we are experiencing a Lehman Moment or an Enron Moment with the implosion of Stablecoins that will be devastating to cryptocurrencies. There is a huge amount of leverage involved in the crypto world that will have systemic effects.
The Enron Effect is about Tether rumored to not having the $89 billion to back up the outstanding Stablecoins. Could be the largest fraud in history.
One Stablecoin broke the buck over the weekend and is at 66 cents today. Others are shaky. Coinbase has crashed before and after earnings announcements. The whole Robinhood, Reddit meme world is crashing. This is extremely unstable for the rest of the stock market too. Not a time to step in front of the train to guess where it will stop.
The inflation announcement led to inflation loving stocks going up like energy, fertilizer, mining. With Russia digging in for a long war, commodity prices will stay high.
The anchoring bias has traders buying things that are down because we have seen them at higher prices and they appear to be bargains. The trap is that they are down for a reason and heading lower. The anchoring bias also prevents traders from buying things that are up because recently they were at lower prices. They seem overpriced even if fundamentals point higher. Nutrien and Mosaic, two fertilizer companies are selling at 6-7 times estimated earnings.
I’m not recommending anything, just discussing the anchoring bias.
I have to agree that the possible crypto (more precisely, Tether) implosion will take broader stocks down with it, even if most of them have nothing to do with cryptocurrencies given the rising correlations.
Coinbase’s (it was a 100B mkt cap company a few months ago) 10y bonds are trading at a 40% discount. This is a sign of non trivial credit risk for the whole crypto scene that has been infiltrating to the traditional capital markets.
Another point that was brought up this morning on Bloomberg is that if Coinbase does declare bankruptcy, their account holders become normal creditors and basically may see their assets go poof as well. So much for “decentralized finance”.
Yes, if you have Bitcoin on deposit with Coinbase, it belongs to creditors. I would expect folks to pull their assets out of Coinbase and put a nail in its coffin.
That won’t be pretty. Bitcoin will drop further. Tesla (and MSTR) will go down as well. ARKK owns a lot of COIN and TSLA so more will sell these shares.
The whole ecosystem of these companies will be in a vicious cycle of selling.
MSTR may get a margin call if Bitcoin drops under $20-$21K. Probably more forced selling.
I don’t understand crypto and have stayed away from it. But, more and more large SIFI institutions are offering it. What sort of risks are they taking/carrying on their books? Other institutions who are insuring that risk? How widespread could it get?
Why no one is talking about it? This is one thing that can blow up things.
Ken, Thanks for the warning!.
I don’t know how big the stablecoin market is. Can stablecoin breaking a buck be considered as equivalent to a money market fund breaking a buck?
What could be the consequences of Tether not having $89bn to backup outstanding Stablecoins? A house of cards falling situation?
A house of cards
A big factor in the stagflation in the 70s must have been oil which we could not really control because of OPEC. This kind of rhymes with the problems we have at present that are out of our control, supply chain disruptions, china lockdowns, Ukraine. Bringing the supply sources closer to home will take time and be inflationary. So we could have stagflation, although for those buying Russian oil, supposedly it is at a discount.
Bitcoin is thermodynamically a losing proposition…you put money in to get money out from someone else, but in the process there is the mining expense so there is a loss…like a hot air balloon and one day the burner stops burning. It is scary because there is so much money involved.
Those companies that are solvent that can make money selling things we need should survive but the unicorns may be endangered.
Thanks for the info on Nutrient and Mosaic
In 1970s, many union contracts also had wage accelerators built-in. That also exacerbated the inflation problem.
I had a desk at WeWork before the pandemic. I met with many founders with questionable ideas/projects. I wonder if they will find funding in the current environment. Doubtful.
Most of you are probably familiar with Helene Meisler’s ‘Mom indicator.’ When her Mom asks about the market, it’s been a contrarian indicator almost 100% of the time. The last time it came up was the day before the last +3% rally – which then reversed the following day.
I experienced two similar moments today – both unexpected and out of the blue. The first occurred when an IT guy whom I’ve known for twenty years came by to fix a printer problem.
We run into each other a few times a year, and he has no idea that I follow the markets closely. As he finished up, he came over and said, ‘I have a piece of advice for you.’ ‘What’s that?’ ‘Don’t look at your 401(k).’ ‘Why?’ ‘It’s down fifteen percent this year.’ ‘No kidding.’
The other was a conversation started by a colleague who knows I follow the capital markets – but also someone who actually brought up the subject with me for the first time. She wanted my opinion on how much further the market might fall.
If the Fed’s goal is to calm inflation by curbing demand, then it appears to be succeeding.
And those same folks wake up and decide “it’s time to sell” and the market goes down….
I don’t understand COIN or Stablecoins, but it’s all reminiscent of all the stuff we suddenly learned about in 2008. Not the same size of course, but a source of instability that forces liquidations and adds to selling.
Cam,
A question… how important are sentiment readings/surveys when 60-70% of the trading volume comes from algos?
Note the programmers – who wrote these algos – are not participating in the surveys.
Don’t forget that something drive the algos. They don’t just exist in a vacuum.
Tether, the biggest stablecoin by far is breaking the buck. That is VERY important. Here is a link to watch the trading.
https://www.livecoinwatch.com/
This could lead to a run to get out like a bank run which is a self reinforcing downward spiral. Tether is third on the list. It should be 1.00. And until today always was.
Tether de-pegged pretty hard ($0.94) before it’s recovering.
Tons of alt. cryptos were minted using Tether ecosystem to start with (in other words, things like Dogecoin or Solana NFTs can only exist because of Tether) and their market cap is pumped to pre-crash Enron level. Dogecoin for once was 95B (and still 10B today). That market cap cannot be right. There simply aren’t that much liquid dollar on the circulation (even E. Musk is having a hard time raising cash from his assets).
ES 3884 the overnight low.
Is there a point at which LT investors capitulate? I don’t know.
A notable difference the past three days is the action in bonds. Bonds seems to have finally reverted to their traditional role as a hedge against stock market declines.
Early action in TLT/ TIP/ IEF/ IEI indicate that I am now completely hedged against the opening decline in stocks. The hope is that bonds will retain their gains when the market finds its footing.
I’m with Ravindra re cryptocurrency. If I don’t understand it, then I’m OK without it – and despite the fact that half the younger folks at work own at least some none of them have been able to explain to me in simple English why they trust something created out of thin air and (to my knowledge) lack any governmental backing.
Gun to head, I don’t believe they have complete faith in the entities that issue the coins. No one’s funding their 401s or 529s with bitcoins!
SPX closing in on a -20% correction.
Liftoff.
Don’t bet against Cam. A tradeable rally is around the corner.
Might even be a double-digit rally.
Added positions in SPY/ QQQ as they transitioned from red to green.
Probably should have closed the positions earlier, but position sizes are quite small. Instead, I’m adding to them here.
The kind of volatility we have right now may require more attention than I’m able to find right now. Setting stops ahead of time.
Taking profits on the second allocations of SPY/ QQQ here in order to lower my basis on the first allocations.
And taking a loss on the first allocation.
If there is going to be a rally, it is going to be when everyone has given up and capitulated, maybe late on a Friday afternoon. Right now there are still too many traders trying to catch a bottom.
Absolutely agree. Give traders the option of capitulation or a weekend in purgatory on Friday – then gap up big on Monday.
Everyone is expecting a rip-roaring rally. Will it happen then? Today, tomorrow or on Monday?
Having said that, no one is expecting a major LT bottom here (like in 2001, 2009 or 2020).
Does there really need to be a capitulation here if all Cam is looking for is a modest bounce?
I have been asking this question myself and if there is going to be a rally, it is really only going to be to make it more difficult for shortsellers to make money. And, full disclosure, I would love to see a rally just to short it again. There are numerous reasons why this is a bear market, but the most convincing one is probably that investors are still trying to fight the Fed.
There are many who tried to call the short term bottom and most like me ended up failing at some point. The following chart may shine a new light on how to call a reprieve in the short term selling by finding the Put Call Volume ratio Equities ($CPVE in stockcharts) point where options traders may show some exhaustion or easing up. The beige (light lime) color showme dots below show such a point, at least in the short term. This showme is not accurate until it is very close to the end of the day. Such a possible exhaustion occured at the EOD today May 12, 2022.
https://ibi.sandisk.com/action/share/86f8ffc2-71c1-4248-8a36-034f0b2ef0c2
Updated EOD chart for Friday May 12, 2022.
$CPVE value remained stubbornly high as its value closed near the high of the day, and those who are long should be aware of the danger of holding on too long when there are too many puts.
https://ibi.sandisk.com/action/share/2c1a9dae-74ef-4d63-b4c3-38420abbfe38
Friday May 13, 2022, typo.
Fear and Greed at 6.
Rather than a whoosh down, might we see a stealth capitulation that goes unrecognized until well after the fact?
The past two weeks feels like a capitulation in slow motion.
Every rally sold.
Now that we’ve become accustomed to the pattern, the market is likely to throw a change-up. Next rally gets bought, not sold.
How do I know? I don’t.
But I’m now reopening the same SPY/ QQQ positions I held briefly this morning in the after market.
No one expects a gap up tomorrow. I think we’ll see it gap and run.
CNN Greed & Fear Index
Now reading: Extreme Fear of 6
https://www.cnn.com/markets/fear-and-greed
My sense is that the sellers are done – at least for now.
Overnight positions in SPY/ QQQ closed.
Adding to existing position in VT.
Markets gapped up just enough to deter sidelined traders from boarding. Hope to see the indexes close at the highs. The real gains will occur in the following weeks.
Cutting back on VT. Went more or less all in ~89 which put me at 40% bonds/60% VT.
Now 40% bonds/ 40% VT. If markets sell off once more, will be trimming back to 40% bonds/25% VT.
Let’s see if the indexes can hold onto their gains for another hour.
Chalk one up for the bulls!