Preface: Explaining our market timing models
We maintain several market timing models, each with differing time horizons. The “Ultimate Market Timing Model” is a long-term market timing model based on the research outlined in our post, Building the ultimate market timing model. This model tends to generate only a handful of signals each decade.
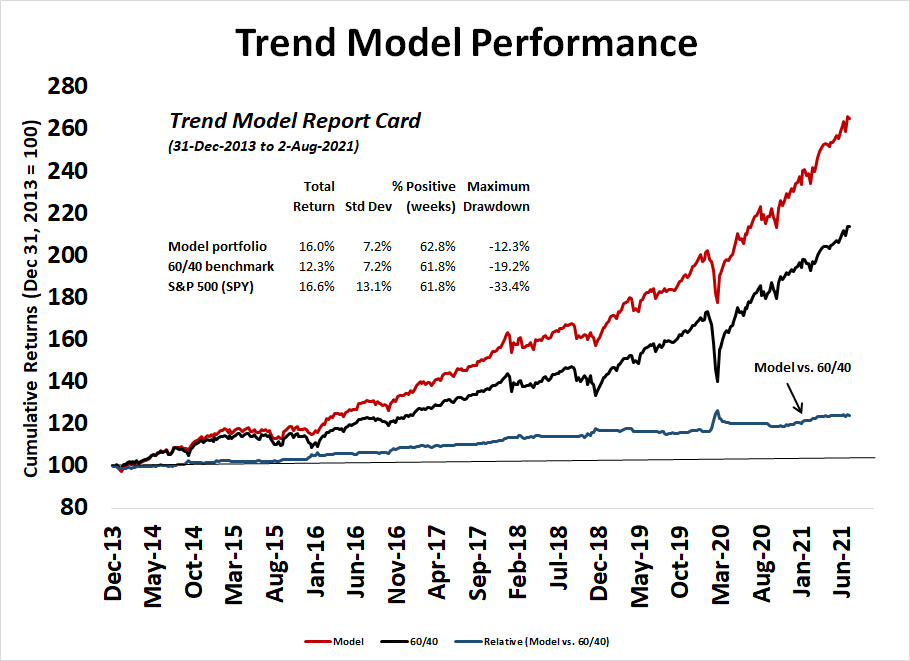
The Trend Asset Allocation Model is an asset allocation model that applies trend following principles based on the inputs of global stock and commodity price. This model has a shorter time horizon and tends to turn over about 4-6 times a year. The performance and full details of a model portfolio based on the out-of-sample signals of the Trend Model can be found here.
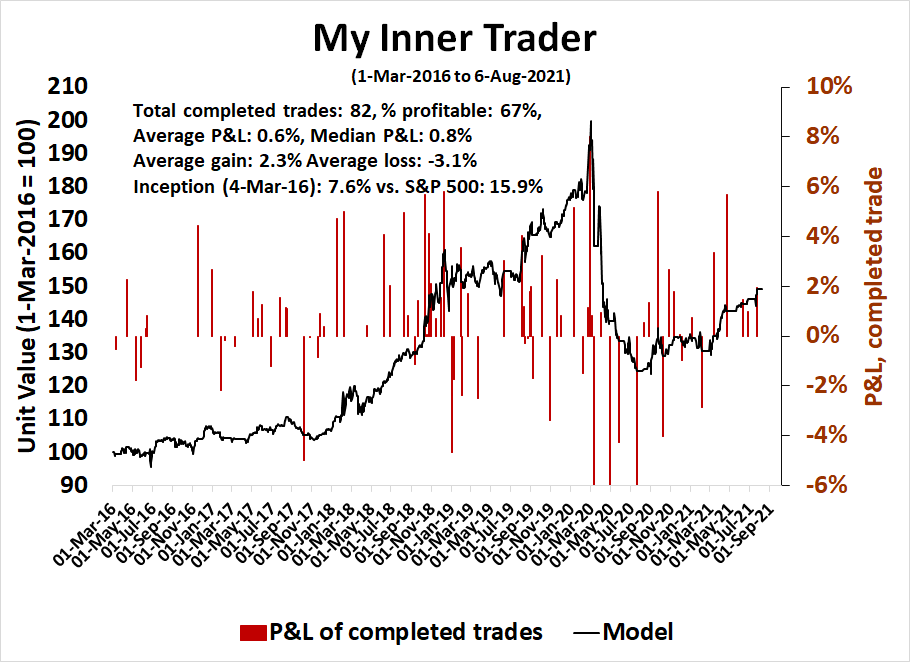
My inner trader uses a trading model, which is a blend of price momentum (is the Trend Model becoming more bullish, or bearish?) and overbought/oversold extremes (don’t buy if the trend is overbought, and vice versa). Subscribers receive real-time alerts of model changes, and a hypothetical trading record of the email alerts is updated weekly here. The hypothetical trading record of the trading model of the real-time alerts that began in March 2016 is shown below.
The latest signals of each model are as follows:
- Ultimate market timing model: Buy equities
- Trend Model signal: Bullish
- Trading model: Neutral
Update schedule: I generally update model readings on my site on weekends and tweet mid-week observations at @humblestudent. Subscribers receive real-time alerts of trading model changes, and a hypothetical trading record of those email alerts is shown here.
Subscribers can access the latest signal in real-time here.
A holding pattern
Regular readers will know that I have been calling for a sideways holding pattern for the S&P 500. That remains my base case scenario for the rest of August. Continuing concerns about the Delta variant stalling growth are likely to put downward pressure on risk appetite. On the other hand, an improving EPS growth outlook is putting a floor on stock prices.
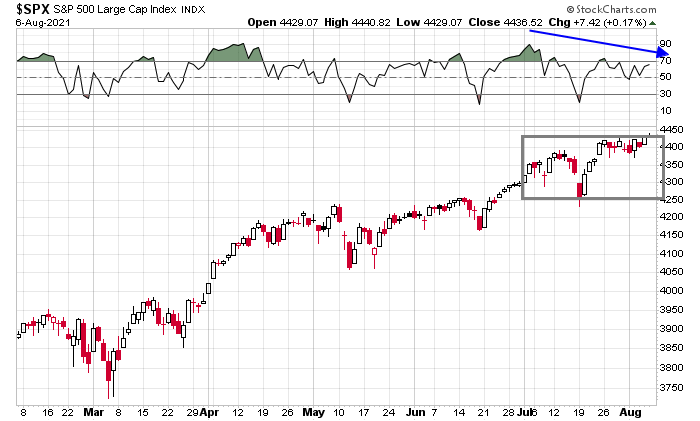
To be sure, the S&P 500 made a marginal new high on Friday, but the market’s less than enthusiastic reception to Friday’s strong jobs report is indicative of the market’s internals and makes my case that the stock market is likely to be range-bound. On the surface, the S&P 500 advance. Looking under the hood, the yield curve steepened and cyclical and value stocks rallied, while growth stocks fell.
The virus: Good news and bad news
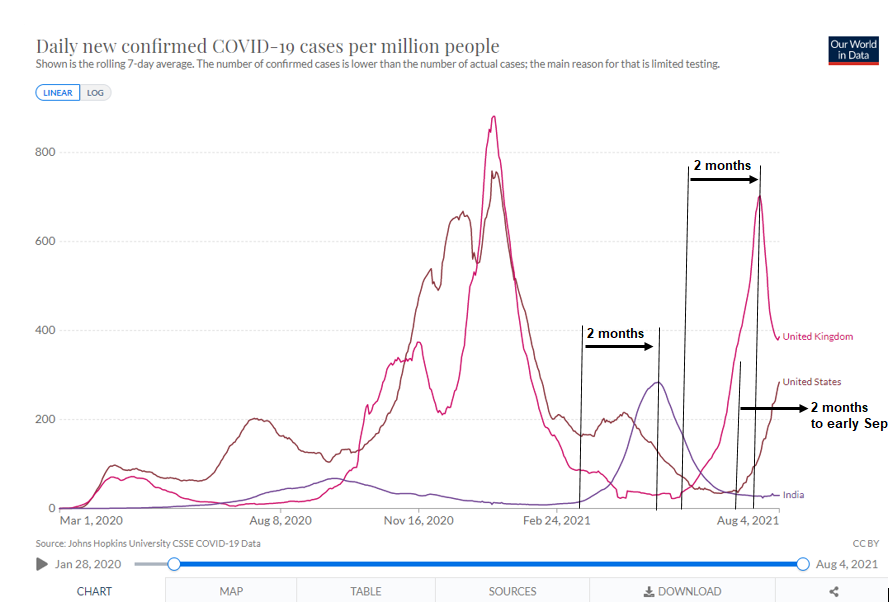
I have some good news and bad news about COVID-19. The bad news is well-known. Almost every day, the media is full of stories about rising infections, especially among the unvaccinated. Events are being cancelled and people are forced to change their behavior. The good news that is US vaccination rates are slowly rising, and the virulent Delta variant has shown itself to peak after two months.
The accompanying chart shows the progress of new case counts per million in India, where the Delta variant first appeared and there were few vaccinated people, and in the UK, which is struggling with the Delta variant but has a highly vaccinated population. In both instances, the infection rate peaks about two months after it first appeared. The rise and fall in the UK case count was steeper than India’s, likely owing to the higher British vaccination rate. In the US, the duration of the ascent in case counts has been a month. Using the India and UK as templates, this puts the US peak in about early September.
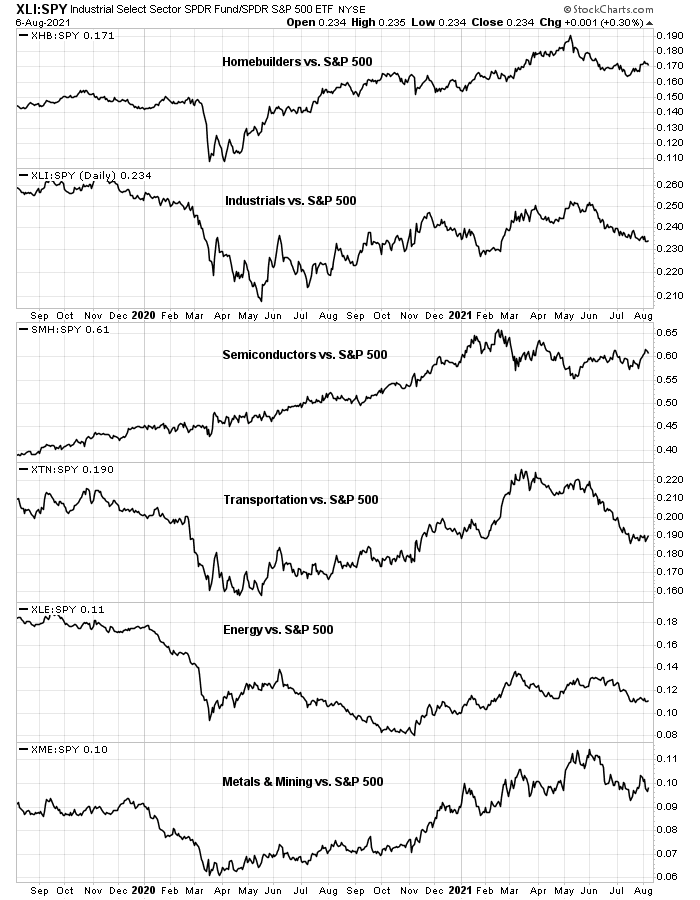
The markets have responded cautiously to these developments. The relative performance of cyclical sectors and industries have stopped falling and they are moving sideways. I interpret these conditions as the market believes the worlds of the growth pause is over, but it is waiting for a new catalyst before launching a new bullish or bearish impulse.
Stellar Q2 earnings
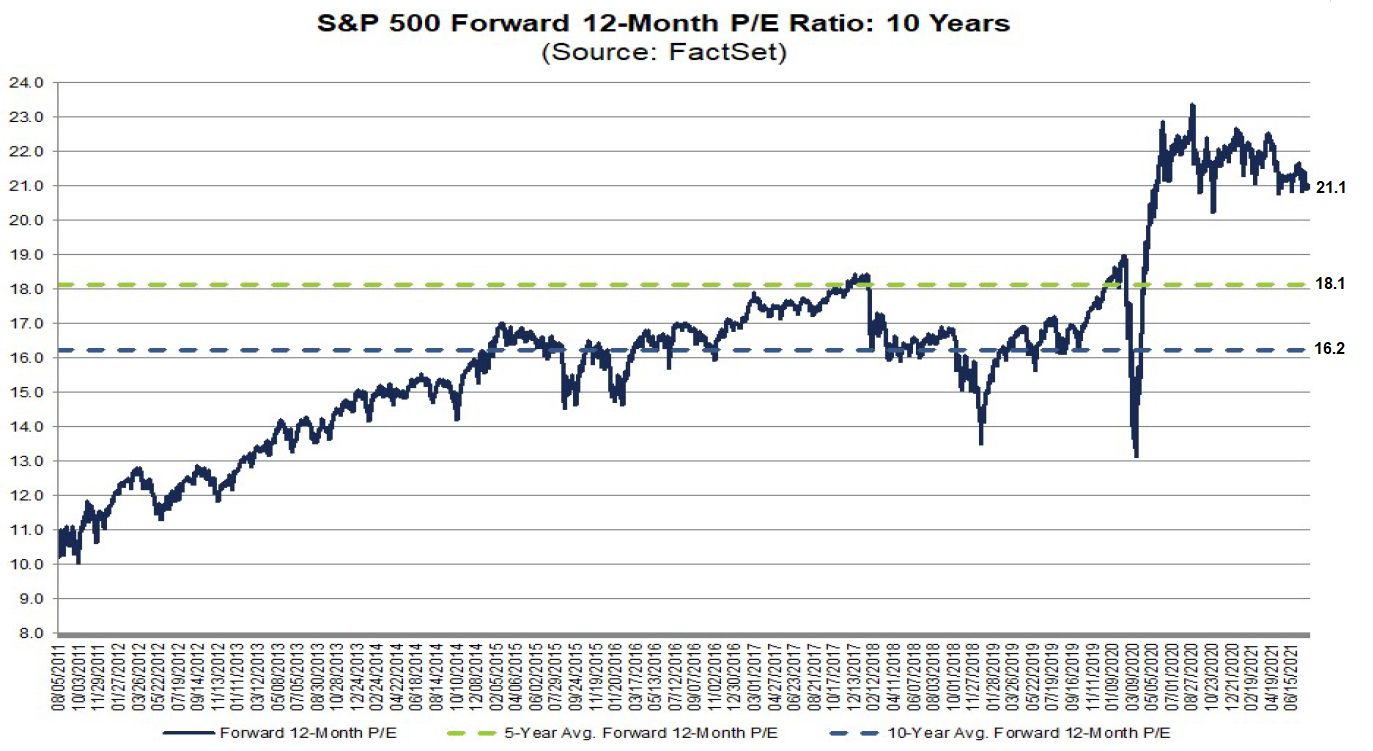
Another bullish consideration is the strength of Q2 earnings results. Both the EPS and sales beat rates are astoundingly high by historical standards and the EPS beat rate would be the highest on record since FactSet started maintaining statistics in 2008. As a consequence, forward 12-month EPS estimates are surging.
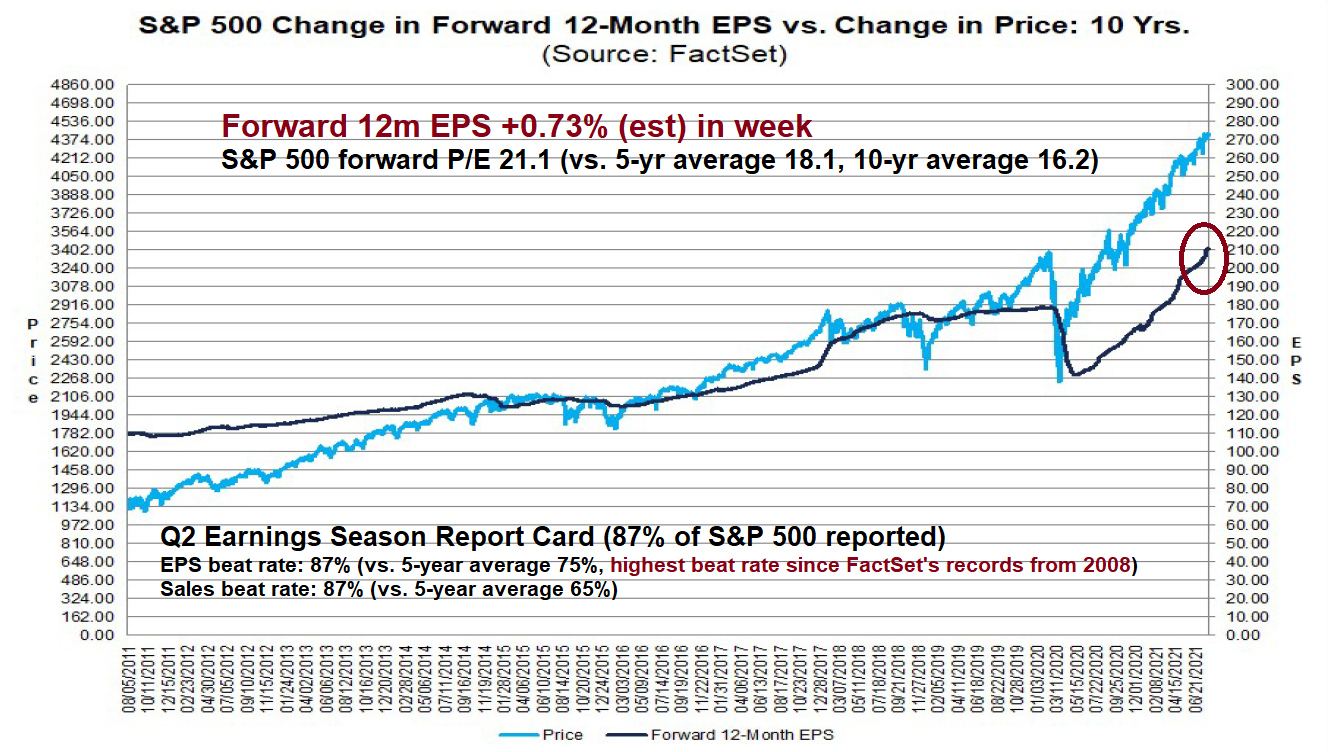
If earnings estimates rise and prices are stable, the forward P/E ratio declines. So far, the S&P 500 forward P/E is nearing the bottom of its post-COVID range, which makes the market more attractive, especially in light of a falling 10-year Treasury yield.
Uncertain leadership
My analysis of the relative performance of the top five sectors of the S&P 500 reveals a story of uncertain leadership. The top five sectors comprise about 75% of index weight and it would be difficult for the market to either rally or drop without the participation of a majority. Of the top five sectors, only healthcare could be described as exhibiting positive relative performance in the last month. The rest are mostly trading sideways or slightly weak compared to the S&P 500.

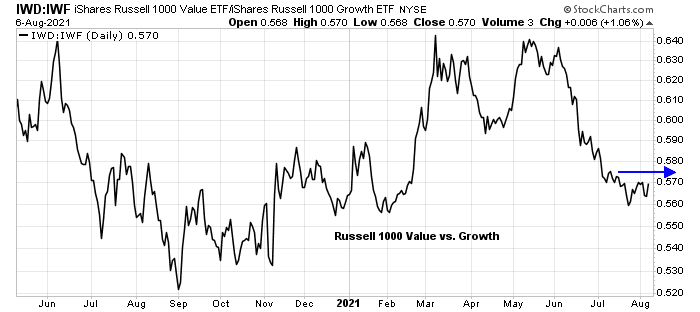
These conditions indicate that the market is marking time and waiting for either a bullish or bearish catalyst. I am reserving judgment until the Russell 2000 breaks out of its tight range. One hopeful sign for the bulls is the Russell 2000 to S&P 500 ratio may be trying to turn up against the S&P 500.

Similarly, the value and growth cycle has been trading sideways in the last month.
The most likely scenario is a continued sideways pattern for another month until it becomes evident that the worst of the Delta variant has run its course, which would be followed by a cyclical and value stock rally. The bearish scenario is a legislative impasse in Washington, either over the debt ceiling or the infrastructure bill. In that case, watch for renewed concerns over economic growth, dovish Fed, falling bond yields, and rising risk aversion.
Is the Fed actually less dovish than the market thinks?
In this research paper Bianchi, Melsoi and Rottner outline a possible communication strategy,that the Fed seems to be following:
https://www.nber.org/system/files/working_papers/w26279/w26279.pdf
Quote:
Opportunistic reaction
Announcing that the central bank will respond less aggressively to inflation when inflation will be above target is time inconsistent if this announcement is made when inflation is below target. Therefore, the central bank needs an opportunity to show the public its commitment to the new asymmetric rule. The arrival of a shock that pushes inflation above target is such an opportunity. We call this scenario opportunistic reaction.
We now investigate the implications for welfare and the macroeconomic outcomes of a central bank pursuing an opportunistic reaction. Let us assume that the economy is initially at the stochastic steady state associated with the symmetric rule when it gets hit by a positive preference shock that boosts consumption and aggregate demand. The central bank receives now the opportunity to show to the private sector that it is willing to commit to the optimal asymmetric rule by responding less aggressively to the inflation consequences of this shock. It is assumed that by observing the muted response to inflation, the private sector immediately believes that the central bank will follow the asymmetric rule forever.
Once the central bank has removed the bias by announcing the asymmetric strategy, it has an incentive to renege on its announcement and to stick to the symmetric rule, which lowers the short-run volatility of inflation.
Fed credibility is on the line, if they do not walk the walk (by not raising rates with hot inflation numbers in the pipeline).
The Fed is on course to make a taper announcement later this year if the NFP figures stay as strong as they did in July.
Fed has no credibility. They were easing aggressively to satisfy politicians before the pandemic when unemployment was at a 35 year low. They backed off their normalisation of interest rates at the end of 2018 when the stock market had small hissy fit. They are scared doves and the outcomes won’t be pretty. They revere Paul Volcker for his wise toughness but don’t follow his example.
Thanks for the feedback, I guess many in the market would agree, but there also seems to be some consensus now on the idea that inflation may not be too transitory. The Fed certainly succeeded in making us all believe that they will remain dovish for many many years.
Just find it very interesting that this kind of non-reaction to inflation was thought about before it all happens as part of a strategy to finally overcome the disinflationary bias in our expectations.
Your point about the Russell 2000 is well taken. A break out would be a good data point for further strength in the market. I added to small caps last week.
My research is with Tactical Factor Allocation that is using the basic four Factors, Growth, Value, Small Company and Low Volatility, WITHIN the business/stock market cycles. There has been enormous research on multi-decade Factor analysis but very little on short term. I believe this is that last area of undiscovered alpha.
There are important Factor clues now as to where we are in the stock market cycle.
I believe the official bull market started on November 9 with the Covid Vaccine Twist. The first phase of a new bull market sees Value and Small Company Factors outperforming massively and they did. These are the Factors that always fall the most in a bear market and hence get very oversold and rebound. The crap Small Cap and Value companies recover more than the good because they went down much more as the teetered towards bankruptcy. This usually lasts about a year (think from Feb 2016 to Feb 2017 at the beginning of the last bull),
The next phase of the bull market sees a sorting of the Value where the good start to outperform and the bad start to stumble. Plus, we transition into the Growth phase of the bull market. Back to the Value stocks, we are at the point where stock selection is important. Long/short hedge funds have done poorly since the market low because their portfolio managers short the crap that is soaring from the low. Now, they should start doing well. It also means that the Value general indexes may appear to be lagging but that is because some of the Value stocks are revealing their weaknesses but others are experiencing strong cyclical earnings growth and doing well. The surge in future earnings that Cam identifies above is not from the consistent Growth stocks, it’s the Value winners. When a massive recession hits and economically sensitive companies are carried to the brink of collapse during the recession/bear market. They cut expenses to the core. When the economy recovers, everyone is shocked that the same level of pre-recession sales results in much stronger profits. We Canadians go through these cycles with our Value oriented index where to Americans these extreme economic dips are new.
So the bull market is alive and well. Stock selection in Value is key and Growth is transitioning into its macro winning stage.
The final stages of a bull sees the Low Volatility Factor index outperforming the other three Factors along with signs of economic stress in the real economy. That is a ways off. Between now and then, I expect a growing, confident bubble mentality that will surprise us on the upside.
Is it too late to buy Canadian stocks?
Probably not too late for Canadian stocks, but your decision will depend on your time horizon.
Can you please elaborate what you mean by “time horizon”? Thanks.
Simple buy what is outperforming when you agree with its narrative on either side of any border.
It seems that Quality factor that provides the alpha going forward. Fidelity estimates that the economy is in mid cycle phase (regardless of when this bull market started) and has room to grow. If Fidelity is somewhat correct, which sectors or factors outperform in the coming months?
Pure Growth ETF RPG
Ken, what do you mean in the 2nd part of the sentence regarding Growth
“Stock selection in Value is key and Growth is transitioning into its macro winning stage.”
Growth Factor includes companies of any industry that have consistent growth of sales and earnings. There is an index for the S&P 500, the S&P 900 and S&P 1500. RPG is the 500 and it is called Pure Growth since it excludes companies that would also qualify as Value that have cheap value characteristics.
Taking stabs at XLE/ KRE/ EWC/ EWZ.
Day trades only.
JETS.
IXC/ PICK.
IJS.
Adding to EWZ.
VTV.
XLI.
All positions off at target.
Forced liquidation in precious metals, or just a waystation on their way much lower?
Gold is a perfect example of Momentum working, in this case negative negative. TRENDS PERSIST.
The world of investing and the forces at play are too complicated or unknown to explain what’s happening. The price is the true answer.
NIO/ PLTR/ QS may be on the verge of active upside sequences. I’ve been trading in and out so far today, but I’m beginning to think about reestablishing core positions.
Opening a position in MJ.
Holding MJ overnight on a bet the sector gaps up in the morning. Back in cash otherwise.