Preface: Explaining our market timing models
We maintain several market timing models, each with differing time horizons. The “
Ultimate Market Timing Model” is a long-term market timing model based on the research outlined in our post,
Building the ultimate market timing model. This model tends to generate only a handful of signals each decade.
The
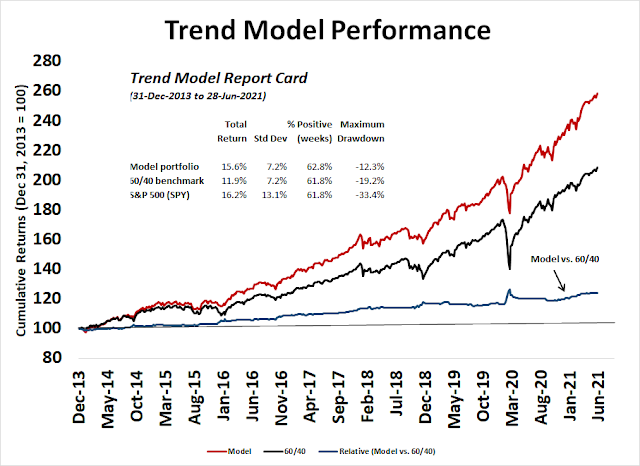
Trend Asset Allocation Model is an asset allocation model that applies trend following principles based on the inputs of global stock and commodity price. This model has a shorter time horizon and tends to turn over about 4-6 times a year. The performance and full details of a model portfolio based on the out-of-sample signals of the Trend Model can be found
here.
My inner trader uses a
trading model, which is a blend of price momentum (is the Trend Model becoming more bullish, or bearish?) and overbought/oversold extremes (don’t buy if the trend is overbought, and vice versa). Subscribers receive real-time alerts of model changes, and a hypothetical trading record of the email alerts is updated weekly
here. The hypothetical trading record of the trading model of the real-time alerts that began in March 2016 is shown below.
The latest signals of each model are as follows:
- Ultimate market timing model: Buy equities
- Trend Model signal: Bullish
- Trading model: Neutral
Update schedule: I generally update model readings on my site on weekends and tweet mid-week observations at @humblestudent. Subscribers receive real-time alerts of trading model changes, and a hypothetical trading record of those email alerts is shown here.
Subscribers can access the latest signal in real-time here.
A magazine cover buy signal?
Investors and traders who stepped up and bought into the market panic last Monday profited handsomely when stock prices staged a relief rally. Another panic opportunity may be presenting itself, this time in the energy sector.
Historically, The Economist magazine covers have been excellent contrarian market signals (see
What a bond market rally could mean for your investments). The Economist may have done it again this week with a focus on the global warming effects of heat waves in North American and floods in Germany.

Notwithstanding the public policy issues, which are beyond my pay grade, here is what it could mean for selected energy equities.
The new tobacco
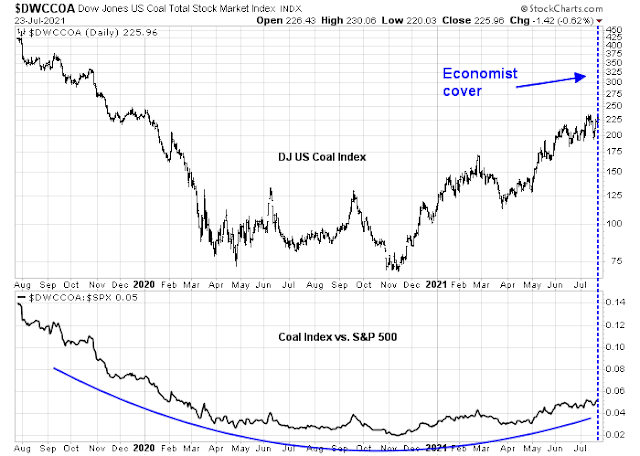
One of the worse culprits of carbon emissions is coal. Coal stocks represent a relatively small part of the market, but here is how this industry has behaved in the last two years. The stocks made a saucer bottom and it is breaking upward, both on an absolute basis and relative to the S&P 500.
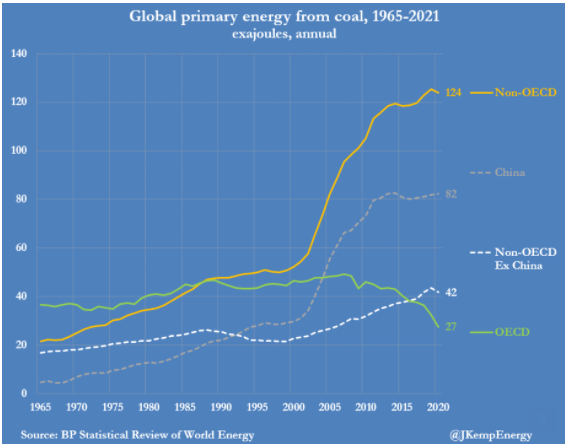
A more detailed analysis of global coal usage shows that OECD countries began to wean themselves off coal as an energy source at the time of the GFC. Chinese coal usage took off in the early 2000s and plateaued about 2014, while other EM coal demand continued to rise. The latest G-20 meeting ended without an agreement on the phaseout of coal powered electrical generation based on objections from China, India, and Russia.
Unfortunately, there are no easy ways to gain a diversified exposure to the industry. The only listed ETF, the VanEck Coal ETF (KOL), closed in December 2020. The lack of interest could be interpreted a contrarian buy signal.
Big Oil tests support
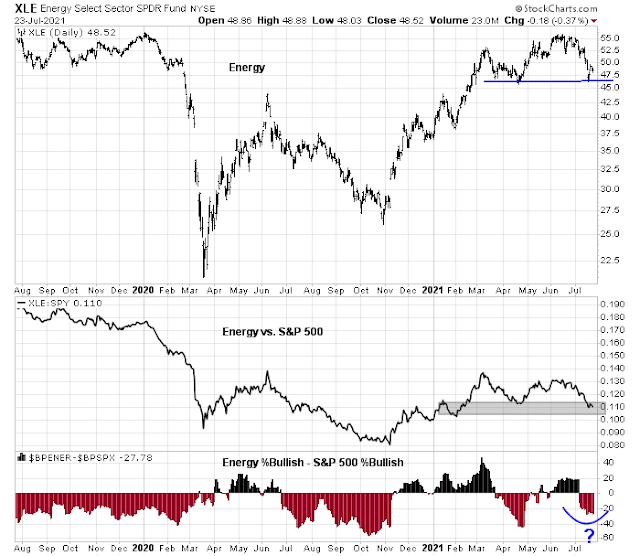
The oil and gas industry is another example of the “new tobacco”. The technical picture for energy stocks is not as bullish as coal. The energy sector is testing key support levels, both on an absolute basis and relative to the S&P 500. Relative breadth indicators are trying to bottom but may need some time to definitively take a position of market leadership.
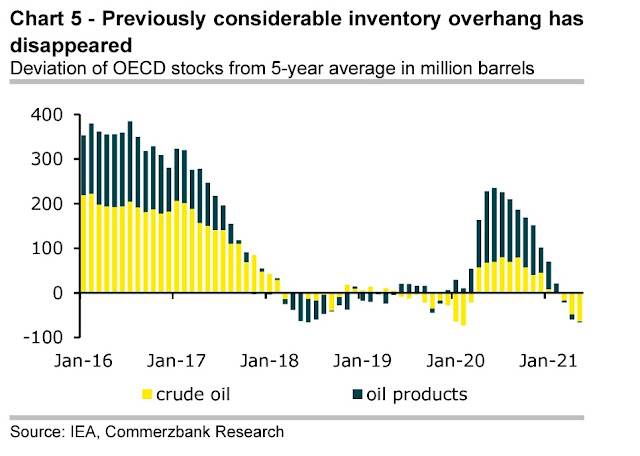
The medium-term supply/demand outlook is constructive. The COVID-related inventory overhang has been worked off. As the global economy recovers, demand should pick up even as producers hesitate to commit to capex in the face of long-term climate change demand pressures.
A panic bottom and recovery
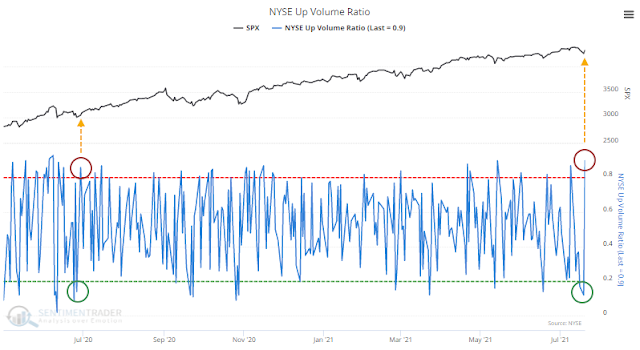
As for the stock market, conditions are setting up for a recovery from last Monday’s panic bottom. Jason Goepfert at
SentimenTrader pointed out that the “Up Volume Ratio cycled from below 15% to above 85% in back-to-back sessions on the NYSE”, which is “a buy signal that has never failed”.
Since 1962, the S&P 500 never showed a loss in the month following similar signals. These mostly occurred during momentum markets, and buyers followed through to avoid missing out on the next bull run. A few of them did end up leading to blow-off peaks, but not until month(s) later.
Technical analyst Walter Deemer observed that Monday’s downdraft represented an 89.4% downside to upside volume day, followed by an 88.0% upside volume day Tuesday and an 83.0% upside volume day on Wednesday. According to the
2002 Dow Award paper by Paul Desmond of Lowry’s Report, consecutive 80% up volume days represent a bullish reversal buy signal after a 90% downside volume panic day.
The historical record shows that 90% Downside Days do not usually occur as a single incident on the bottom day of an important market decline, but typically occur on a number of occasions throughout a major decline, often spread apart by as much as thirty trading days…
Our 69-year record shows that declines containing two or more 90% Downside Days usually persist, on a trend basis, until investors eventually come rushing back in to snap up what they perceive to be the bargains of the decade and, in the process, produce a 90% Upside Day (in which Points Gained equal 90.0% or more of the sum of Points Gained plus Points Lost, and on which Upside Volume equals 90.0% or more of the sum of Upside plus Downside Volume). These two events – panic selling (one or more 90% Downside Days) and panic buying (a 90% Upside Day, or on rare occasions, two back-to-back 80% Upside Days) – produce very powerful probabilities that a major trend reversal has begun, and that the market’s Sweet Spot is ready to be savored.
Zweig Breadth Thrust watch
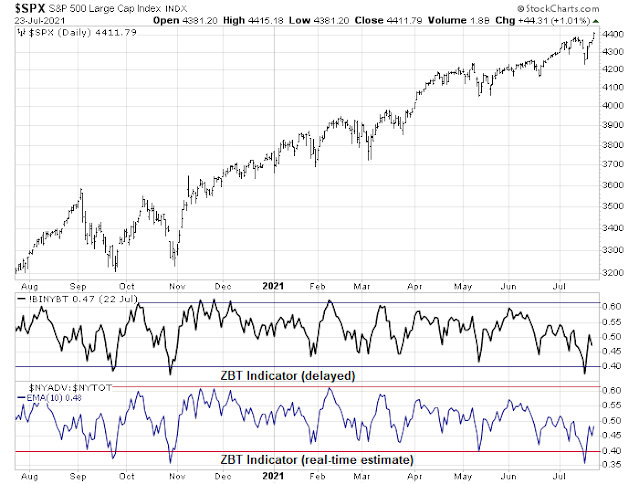
As part of the same theme of price momentum reversal, we have a potential rare Zweig Breadth Thrust buy signal setup. The ZBT buy signal is a rare momentum-based buy signal that occurs only once every few years and almost never fails. It requires the market to move from an oversold condition to an overbought reading within 10 trading days. The ZBT Indicator went oversold last Monday, and Tuesday, July 20 was day 1 of the ZBT buy signal watch. The window for flashing a buy signal ends on Monday, August 2.
This is only a trade setup. I am not holding my breath for the buy signal.
Key risks
There are a number of key risks to the bullish scenario. First, the S&P 500 has rallied back to an all-time high. On the other hand, the 5 and 14-day RSIs are flashing negative divergences.
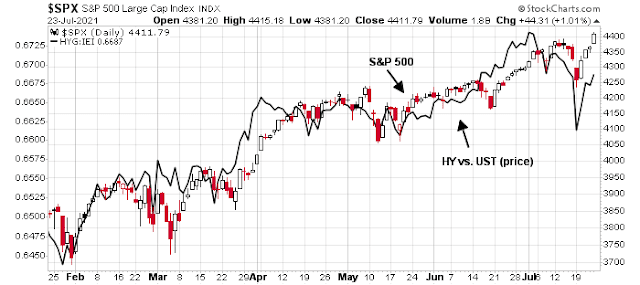
As well, credit market risk appetite is not behaving well. The relative price performance of junk bonds to their duration-equivalent Treasuries is exhibiting a minor negative divergence, which is another concern.
The week ahead
Looking to the week ahead, traders need to distinguish probable market direction based on differing time frames. I am inclined to lean bullish on a 1-2 week time horizon.
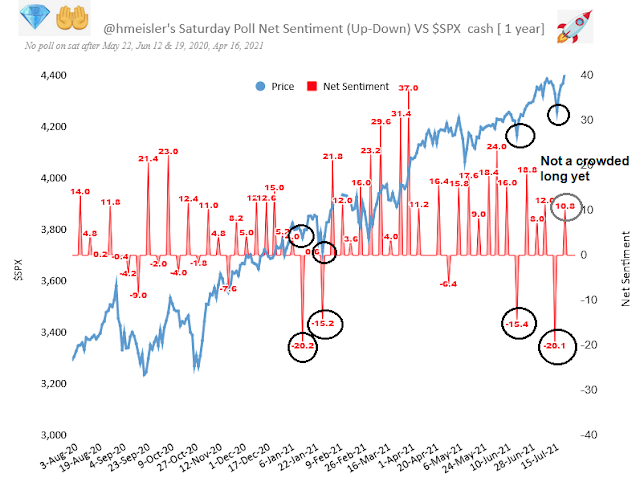
Helene Meisler conducts a weekend (unscientific) Twitter poll. Sentiment had plunged to negative double-digits the previous week, and such readings had marked tradable bottoms in the past. The latest week’s sentiment survey saw a bullish snapback, but conditions are not at a crowded long, which gives the bulls the run to run.
As well, option sentiment derived tail-risks are rising, as evidenced by the pricing of August VIX call options. I attribute this to the pricing of event risk based on what might occur at the Fed’s Jackson Hole gathering. As the market is pricing in sizable QE taper style announcements from Jackson Hole, this puts a floor on any taper trantrum risk-off episodes in the coming weeks.
In the very short-term, breadth is extremely overbought. Even if you are bullish, expect a pause or pullback early in the week.
In conclusion, coal and energy equities represent potential contrarian buying opportunities for investors. In addition, the stock market appears to have undergone a bullish reversal off a panic bottom, which should resolve in higher prices in the days and weeks ahead.




People who follow my momentum research know that I do the normal momentum longer term price momentum style (mine is a 6 month lookback) But as a new advance on the old theory, I also rebase the ETFs at intermediate lows and check the leaders and laggards from that low to check if leadership has changed. The intermediate low is based on Sentimentrader and RecessionAlert pessimism in certain sentiment indicators plus a liftoff.
So July 19, was that rebase low. From that day, all four Value and Growth are doing well. This is unusual since the last year has seen either Value or Growth outperform massively after rebase lows, It was black or white.
Low Vol and most Defensives are lagging so the move up is very Risk-on.
The regions are very different with Far East extremely poor, Europe just okay and North America (includes Canada) a clear leader.
The bull market Factor Rotation goes first up Small Cap and Value, then Growth and then Low Vol. It may be that the Growth phase has started.
This doesn’t mean a Value company or industry can’t outperform but what I am seeing is that stock selection is now key. Value as a group is not charging ahead.
One area that seems to be rising up in performance ranks is ESG. It is Tech oriented and no Energy. The Green Movement and even Green Banking might lead to better profitability for ESG compliant companies and shunning of non-compliant.
I want to give a shoutout to Home Construction. D.R. Horton in their analyst call report a big profit beat but said disruptions (lumber and other materials and supply chains) would have the voluntarily constraining home building. The stock dropped 4% at the opening the next day. Then there were a few Buy upgrades and the stock flew up dramatically along with the ITB Home Construction ETF flying up. People are first shocked and then looking beyond current short-term disruptions of Value oriented economically sensitive companies. This is why the general index could have a big leg up here.
Right on, Ken. Stock picking going forward. Besides the usual suspects of Tech, there are interesting but seldom mentioned areas offering good prospect: pets, diabetes, biotech arms dealer, biz info support service, etc.
One thing about Tech is that those co’s are fond of sloganeering and virtual signaling. It was started by Steve Jobs. Totally out of control today. Even the most stupid people would not believe any bit of it. It is very easy for tech co’s to be on ESG bandwagon because most of them don’t own real production equipment and material.
Say you are a software company. All you have to say is: “All our power usage is from renewable source.” Voila! You are now on ESG pedestal. I suggest they go one step further and set up an internal carbon-trading system, based on the body weight. Every employee is a participant by mandate. Some employees will die like Karen Carpenter did. The world’s carbon print will be therefore reduced. Just a joke. Don’t attack me. Just want to highlight the ESG absurdity in the Western world.
Home building will be very good now that lumber price is back to normal. It probably will settle in a range of $400-600 in the future.
Down here in Australia, BHP has very recently decided it wants to exit the energy business and it has been a true believer in this sector for a very long time. Their price forecasts are good so that is pretty telling as a long term view. Definitely agree XLE setting up nicely for a trade though. There are a few metallurgical coal companies here in Australia that are investable.
At the top of my inbox this morning-
‘Fall in love with the masterpiece, and also the paint on the floor.’ -Morgan Harper Nichols
It may have been the quote that led me to read further, but it was the poster’s comments that resonated with me:
‘[Nichols’] work frequently tackles the in-between moments of life — like learning to sit with uncertainty..]’
Trading is all about the in-between moments on just about every level. Positioned in the ‘wrong’ sectors/stocks and taking hits on EEM/FXI/ASHR/BABA/XLE last Friday? That’s part and parcel of a game where new opportunities lie around every corner. Had I NOT opened the positions on Thursday? There is little doubt that I would have opened the exact same positions on Friday – in which case, I would be looking at twice the damage this morning.
https://www.reuters.com/world/china/how-delta-variant-upends-assumptions-about-coronavirus-2021-07-26/
Excerpts:
“There is always the illusion that there is a magic bullet that will solve all our problems. The coronavirus is teaching us a lesson,” said Nadav Davidovitch, director of Ben Gurion University’s school of public health in Israel.
‘Genomics expert Eric Topol, director of the Scripps Research Translational Institute in La Jolla, California, noted that Delta infections have a shorter incubation period and a far higher amount of viral particles.
“That’s why the vaccines are going to be challenged. The people who are vaccinated have got to be especially careful. This is a tough one,” Topol said.
In the United States, the Delta variant has arrived as many Americans – vaccinated and not – have stopped wearing masks indoors.
“It’s a double whammy,” Topol said. “The last thing you want is to loosen restrictions when you’re confronting the most formidable version of the virus yet.”
The development of highly effective vaccines may have led many people to believe that once vaccinated, COVID-19 posed little threat to them.
“When the vaccines were first developed, nobody was thinking that they were going to prevent infection,” said Carlos del Rio, a professor of medicine and infectious disease epidemiology at Emory University in Atlanta. The aim was always to prevent severe disease and death, del Rio added.
The vaccines were so effective, however, that there were signs the vaccines also prevented transmission against prior coronavirus variants.
“We got spoiled,” del Rio said.
NIO/ QS/ PLTR.
Out of all positions.
Reopening NIO.
Reopening QS/ PLTR.
VTV/ XLF/ XLE.
Adding KRE.
Adding to NIO.
Closing all positions here for a loss on the day.
My goal right now is not to capture broad moves up, as I don’t believe that to be a high-odds trade. It’s simply to try hitting daily targets while keeping account balances near all-time highs.
BABA at a 52-wk low.
Reopening positions in FXI/ EEM/ ASHR/ BABA.
I suspect we may see better entries later this morning, but I’m buying into steep declines and have to start somewhere.
https://www.npr.org/sections/health-shots/2021/07/22/1019475669/delta-variant-will-drive-a-steep-rise-in-covid-deaths-model-shows
The latest Covid surge is predicted to peak in mid-October.
XLE/ KRE/ VTV.
XLI.
VEU/ VT.
GDX.
INTC.
SMH.
QQQ.
COIN. RIOT. Small.
IWM.
PICK.
EFV.
Adding to EEM.
A decent amount of negativity this morning, which heightens the odds of a bounce – not so much in the indexes but in 80% of stocks that are seemingly already in bear markets.
Adding to PICK.
Added a little AMZN/ AARK earlier.
Adding EWZ.
Adding second or third allocations to most positions heading into the close. I think we saw enough panic today to warrant holding the positions overnight at least.
Closing a few positions in the premarket session.
NIO (+4.3%)/ COIN (+2.25%)/ RIOT (+6.76%)/ BABA (+2.38%).
Hope to reopen all four positions in the first hour of the regular session.
Taking the +2.6% gain on ASHR.
On the other hand, I was able to close NIO at the high.
Taking the +1.8% gain on FXI.
Taking the +0.81% gain on EEM.
Closing JETS.
All positions off in the first ten minutes.
+0.72% on the day.
My base scenario remains essentially bearish.
My one regret is closing QS prior to the +10% spike.
Reopening XLE/ KRE.
Closing both positions. Conviction level was low.
Taking a higher-conviction swing here at XLE/ KRE/ VTV.
Reopening JETS.
Reopening IJS.
Reopening NIO/ QS.
Closing NIO here.
Closing KRE. Closing XLE.
Closing JETS.
Closing IJS.
VTV off here.
Back to cash ahead of FOMC.