Mid-week market update: As the market enters into Q2 earnings season, FactSet reported that consensus estimates are calling for an astounding 63.3% YoY EPS growth.
While that growth estimate appears to be a high bar, investors have to keep in mind the low base effect. As well, the historical record shows that actual growth has tended to exceed estimates. In other words, the bears shouldn’t count on earnings disappointment as a catalyst for a price downdraft.
S&P 500 target: 4803.62
FactSet further reported that the bottom-up derived S&P 500 target is 4803.62, which is 11.2% above last Thursday’s closing level (the publication date of the report).
How accurate have those estimates been? It depends on what your lookback period is in determining the track record. They’ve been underestimating returns over the past five years but overestimating returns over longer time frames.
Over the past five years, Industry analysts have underestimated the price of the index by 0.5% on average (using month-end values). Over the past 10 years, industry analysts have overestimated the price of the index by 1.5% on average (using month-end values). Over the past 15 years, industry analysts have overestimated the price of the index by 9.1% on average (using month-end values). It is interesting to note that on June 30, 2020, the bottom-up target price was 3327.64. One year later (on June 30, 2021), the S&P 500 closing price was 4297.50. Thus, industry analysts underestimated the closing price at the end of June 2021 by nearly 23% one year ago.
In light of recent results, it’s hard to be too bearish on the stock market.
Sentiment warnings
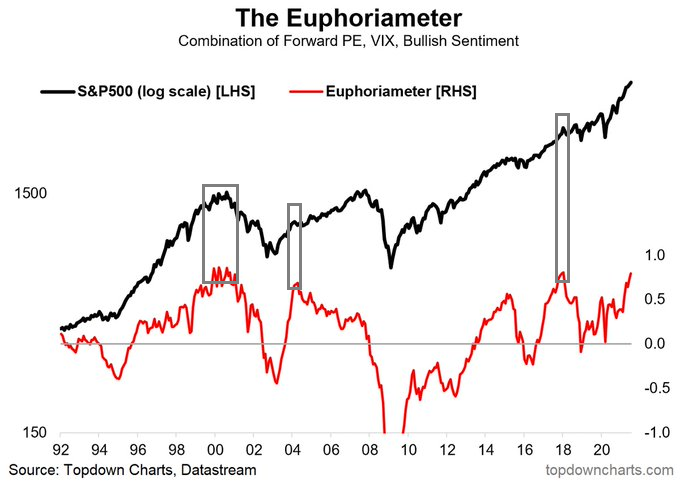
This does not mean, however, that the stock market can rise in a straight line. Sentiment models have been flashing warning signs for some time, but sentiment can be an inexact timing signal when readings are overly giddy. As an example, Callum Thomas’ Euphoriameter is at a bullish extreme. The historical record shows that the market has continued to either advance or trade sideways on the occasions when it has been this high.
NDR’s Crowd Sentiment is similarly stretched. The S&P 500 has exhibited tepid returns when readings have been this high. However, the historical annualized gain of -0.5% is hardly a strong reason to short the market.
The internal rotation continues
Willie Delwiche observed that only a quarter of global markets are above their 50 dma and the S&P 500 has historically struggled under such conditions.
This time may be different. As I have pointed out endlessly, the market is undergoing an internal rotation between growth and value. US equities have taken on growth characteristics owing to the large weighting in large-cap technology stocks in the S&P 500, while non-US stocks have taken on value characteristics by default. Value is on the ropes, but the value/growth ratio is exhibiting a positive RSI divergence and a nascent breadth turnaround.
Watch small caps!
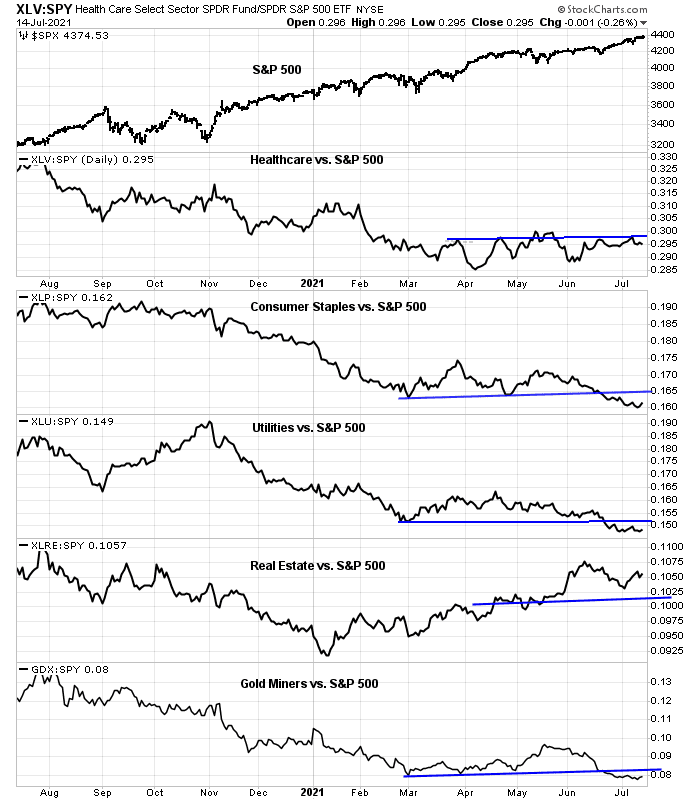
Where does that leave us? I am not overly concerned about a significant downdraft. The relative performance of defensive sectors are not showing any leadership qualities with the exception of real estate.
My base case calls for a period of sideways consolidation, but I am watching small-cap stocks as a barometer that the market could stage a surprise rally. The Russell 2000 has been trading sideways in a range-bound pattern since February, but it is testing an important Fibonacci relative support level.
Interestingly, the S&P 600, the “other” small-cap index, is behaving much better than the widely watched Russell 2000. S&P has much stricter profitability inclusion criteria and it therefore has a higher quality bias. The S&P 600 is in a minor uptrend and it is only testing the 50% retracement level relative to the S&P 500, whereas the Russell 2000 to S&P 500 ratio is testing its 61.8% retracement level.
Ironically, the widespread evidence of negative breadth has translated into near bullish conditions. Both the NYSE and NASDAQ McClellan Oscillators are nearing oversold levels which have been signals of tradable bottoms.
Stay tuned for further developments, and don’t get too bearish.


Reopening positions in XLE/ XLF in the premarket session.
NIO/ QS/ PLTR/ CGC – keeping it small, but I like the fact that they’re holding up nicely despite negative indications in the indices.
Will be reopening VTV/ XLI into the opening gaps down.
Closing NIO.
Closing QS.
Closing PLTR.
All positions off here.
Now turning bearish.
At some point, buying the dip stops working.
Preliminary data suggest that the delta variant may be more contagious but less lethal. There is an interesting article in The NY Times by David Leonhardt. However I couldn’t find enough data to make a solid assessment
It may be less lethal but given the potential for long-term complications (which have yet to be fully elucidated/ understood), I would opt on the side of caution. A return to masking in LA is probably just the start.
My watch lists are filled with what I consider shots across the bow today. Might it pay off to buy the dip(s)? Sure, it might – but I don’t view the risk/reward as attractive.