Preface: Explaining our market timing models
We maintain several market timing models, each with differing time horizons. The “Ultimate Market Timing Model” is a long-term market timing model based on the research outlined in our post, Building the ultimate market timing model. This model tends to generate only a handful of signals each decade.
The Trend Asset Allocation Model is an asset allocation model that applies trend following principles based on the inputs of global stock and commodity price. This model has a shorter time horizon and tends to turn over about 4-6 times a year. The performance and full details of a model portfolio based on the out-of-sample signals of the Trend Model can be found here.
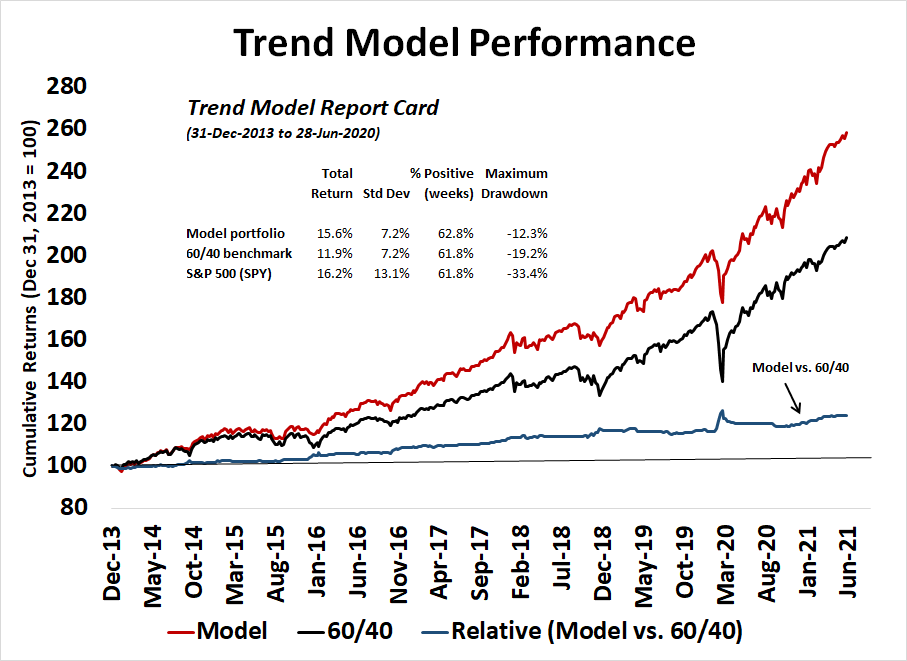
My inner trader uses a trading model, which is a blend of price momentum (is the Trend Model becoming more bullish, or bearish?) and overbought/oversold extremes (don’t buy if the trend is overbought, and vice versa). Subscribers receive real-time alerts of model changes, and a hypothetical trading record of the email alerts is updated weekly here. The hypothetical trading record of the trading model of the real-time alerts that began in March 2016 is shown below.

The latest signals of each model are as follows:
- Ultimate market timing model: Buy equities
- Trend Model signal: Bullish
- Trading model: Neutral
Update schedule: I generally update model readings on my site on weekends and tweet mid-week observations at @humblestudent. Subscribers receive real-time alerts of trading model changes, and a hypothetical trading record of those email alerts is shown here.
Subscribers can access the latest signal in real-time here.
Brace for minor bumpiness
It finally happened. After all of the warnings about negative breadth divergences, it looks like the S&P 500 took a pause from the upper Bollinger Band ride that I identified last week.

While the stock market may experience some minor bumpiness, investors should nevertheless respect the market’s uptrend and expect any pullback to be relatively shallow.
Warning signs
The warning signs were all there. In addition to the breadth divergences, sentiment models were indicating capitulation by bearish traders. The latest Investors Intelligence survey were showing that the percentage of bears had fallen to 15.5%, which is a reading that was only exceeded in 2018.

Despite the renewed NASDAQ leadership, its internals were weak. SentimenTrader observed that the NASDAQ Composite achieved a 52-week high last week on record poor breadth.

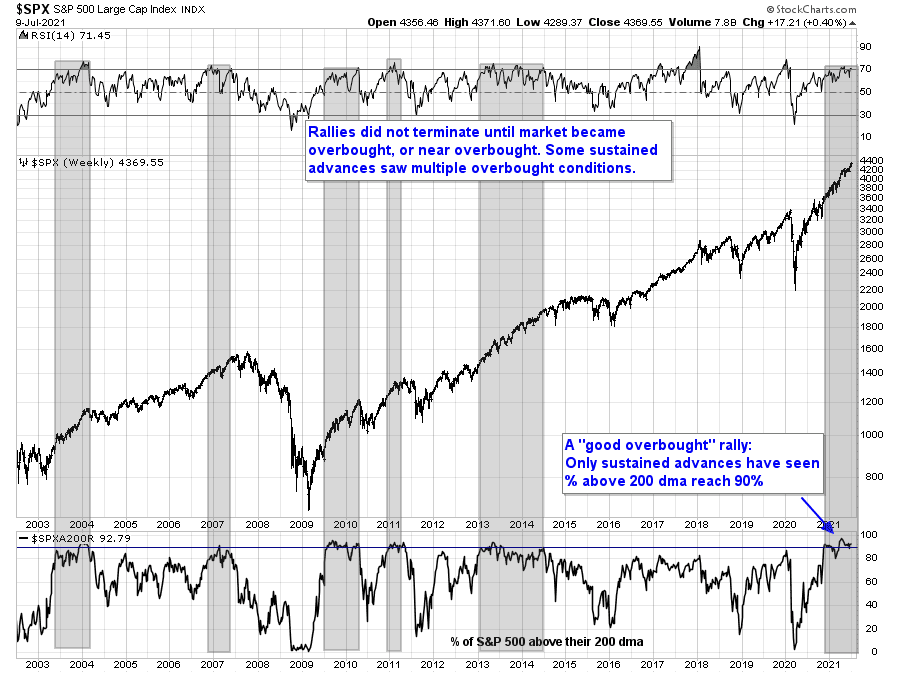
Still an uptrend
While short-term breadth has been negative, long-term breadth remains constructive. The percentage of S&P 500 stocks above their 200 dma remains above 90%. This is the characteristic shown by the market in strong uptrends.
Pullbacks should be shallow
Another warning had appeared in the correlation of the S&P 500 with VVIX, or the volatility of the VIX Index. Spikes in correlation have tended to resolve with market weakness about two-thirds of the time (blue vertical lines=continued strength, red=weakness). With only one exception in the last three years, pullbacks have been a relatively shallow -5% or less.

If the market were to weaken, the bottom has been signaled by a spike by the VIX Index up to its upper Bollinger Band.
Another reason for my belief of a shallow market weakness can be found in the lack of cross-asset warnings. The relative performance of junk bonds to their duration-adjusted Treasury counterparts remains benign. Credit markets are not signaling any signs of significant stress.

To be sure, a minor negative divergence has occurred in one of my equity risk appetite indicators. The ratio of high beta to low volatility stocks is falling more than the S&P 500. On the other hand, the equal-weighted ratio of consumer discretionary to staples, which minimizes the outsized influence of Amazon and Tesla in the consumer discretionary sector, is flashing a neutral reading as it is tracking the movement of the S&P 500.

If the S&P 500 were to weaken, the tactical window for a decline opens early in the week. Breadth is overbought and the market is ripe for a pullback.

Q2 earnings season then kicks off Tuesday when the banks begin their reports. Brace for volatility.

In summary, the stock market may finally be undergoing a minor corrective episode after numerous warnings of negative breadth and excessively giddy sentiment. However, the intermediate-term trend is still up. If history is any guide, downside risk should be limited to -5% or less.
Respect the uptrend. Buy the dip.
It’s good to remember the NASDAQ Composite is a huge number of very small stocks. The NASDAQ 100 portion is over 90% of market cap. So the chart above is more of a small cap and Reddit stat
Watching XLF, KRE performance closely (relative to SPY).
Any thoughts on Chinese ADRs? They are all down significantly and have lagged the US Tech badly.
One thought is that Beijing still wants its select companies to list overseas to raise capital. Beijing needed to warn the large tech companies and remind them who the boss is. The threat of regulatory regime and Beijing will recede and won’t be on the front pages in coming weeks and months. The shares should bounce if that happens.
I wouldn’t venture a guess on Chinese policy. Total wildcards.
Thanks, Cam!
Interesting take on Chinese bonds.
https://www.marketwatch.com/story/bonds-that-can-thrive-despite-higher-global-inflation-and-interest-rates-11625248562
Letting go my position in TLT here. Out flat.
Not really sure where I think the market is headed from here , but I don’t spot any good entries either way. Cash is a position.
Taking swings at two positions here. GDX and QS.
Tomorrow is CPI. NQ may drop if CPI is hot (XLI, XLF, XLB may rally).
Closing positions in GDX and QS.
Opening KRE.
Closing KRE.
Turning bullish on finanicals/ energy/ industrials.
Opening positions in VTV/ KRE/ XLF/ XLE/ XLI.
Opening a position in AA.
Opening a position in BA.
Adding to XLE after hours.
Opening a position in NIO after hours.
Reopening a position in QS after hours.
Closing AA. Closing JETS.
Closing XLE. Paring back on KRE.
Closing KRE and XLF.
Paring back on VTV/ XLI.
All positions off here. I’ve hit my target for the day.
The morning gap-up now feels like a bull trap.
https://www.marketwatch.com/story/delta-variant-drove-covid-19-cases-higher-across-the-globe-last-week-including-in-the-u-s-11626273617?mod=home-page
At some point it crosses the line from nothing to worry about if vaccinated to a potentially serious threat even if vaccinated.
Taking another stab at XLF/ KRE/ XLE/ XLI.
JETS.
COIN.
VTV.
Hard to tell if current levels are where the trapped bulls capitulate.
PAVE.
PICK.
All positions off here. Taking a small loss on the second set of trades, which is all I’m willing to give back.