Preface: Explaining our market timing models
We maintain several market timing models, each with differing time horizons. The “Ultimate Market Timing Model” is a long-term market timing model based on the research outlined in our post, Building the ultimate market timing model. This model tends to generate only a handful of signals each decade.
The Trend Asset Allocation Model is an asset allocation model that applies trend following principles based on the inputs of global stock and commodity price. This model has a shorter time horizon and tends to turn over about 4-6 times a year. The performance and full details of a model portfolio based on the out-of-sample signals of the Trend Model can be found here.

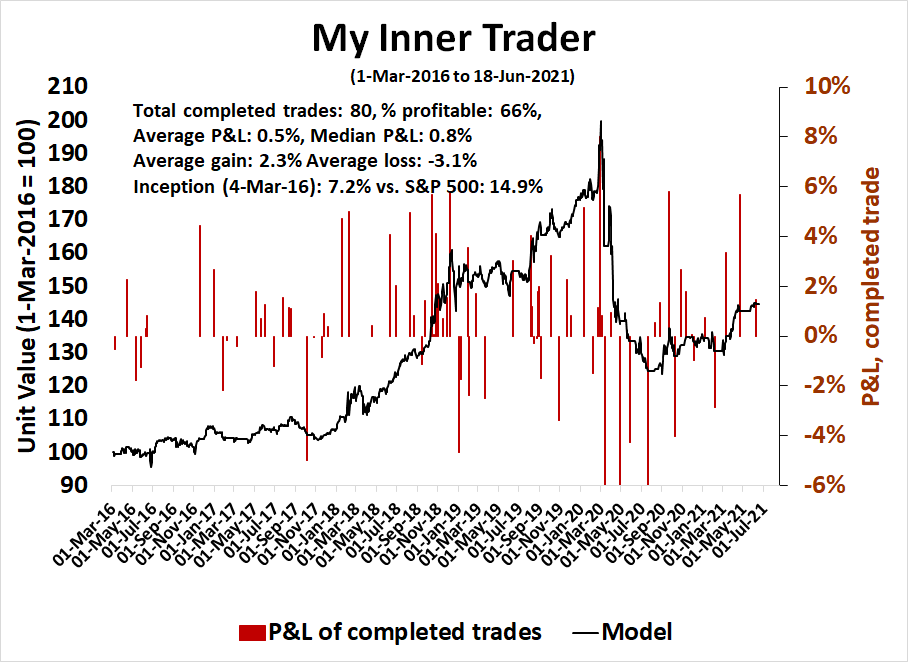
My inner trader uses a trading model, which is a blend of price momentum (is the Trend Model becoming more bullish, or bearish?) and overbought/oversold extremes (don’t buy if the trend is overbought, and vice versa). Subscribers receive real-time alerts of model changes, and a hypothetical trading record of the email alerts is updated weekly here. The hypothetical trading record of the trading model of the real-time alerts that began in March 2016 is shown below.
The latest signals of each model are as follows:
- Ultimate market timing model: Buy equities
- Trend Model signal: Bullish
- Trading model: Neutral
Update schedule: I generally update model readings on my site on weekends and tweet mid-week observations at @humblestudent. Subscribers receive real-time alerts of trading model changes, and a hypothetical trading record of those email alerts is shown here.
Subscribers can access the latest signal in real-time here.
The Fed’s hawkish pivot
How should investors interpret the Fed’s unexpected hawkish turn? The 10-year Treasury yield rose dramatically after the FOMC meeting, but retreated after the initial surge. The S&P 500 fell in the wake of the Fed announcement. While did violate an important downtrend, the violation needs to be confirmed in light of Friday’s triple witching expiry volatility.

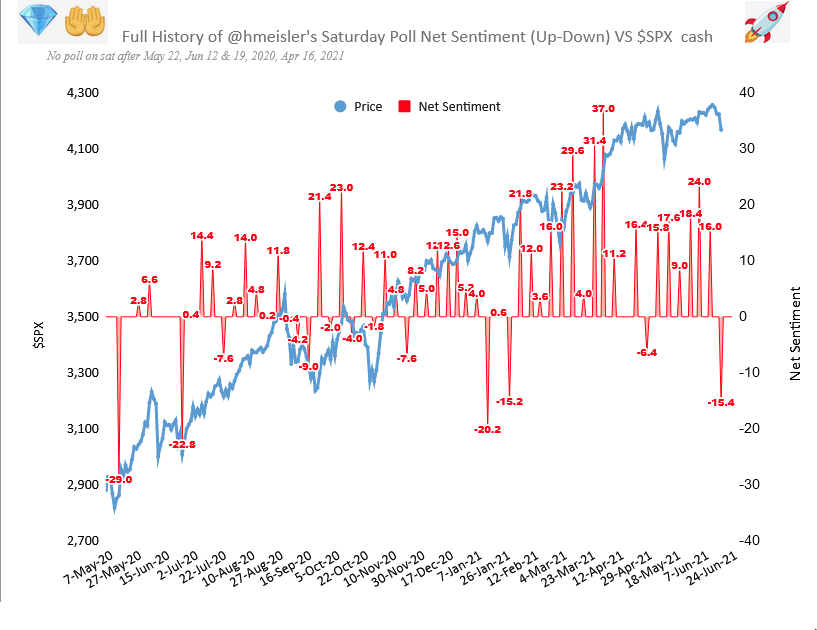
Helene Meisler’s weekly (unscientific) Twitter sentiment poll took a 30 point tumble from net bullish to net bearish. Indeed, Fed Chair Jay Powell has managed to the children.

Will that be enough to put a floor on stock prices?
The bears aren’t in control
First, let me put the bearish fears to rest. The bears haven’t seized control of the tape yet. The relative performance of defensive sectors shows that they are not behaving well. With the exception of REITs, none are showing any signs of strong relative strength.

In addition, my bottom spotting model has flashed three out of four possible oversold signals, indicating that a tactical bottom is near. The 5-day RSI is deeply oversold. The VIX Index has spiked above its upper Bollinger Band, which is also another sign of a possible short-term bottom. As well, the NYSE McClellan Oscillator has declined to levels consistent with past trading bottoms.

Macro Charts concurs with my analysis. The market is oversold, and cyclicals are extremely oversold.

A tale of two markets
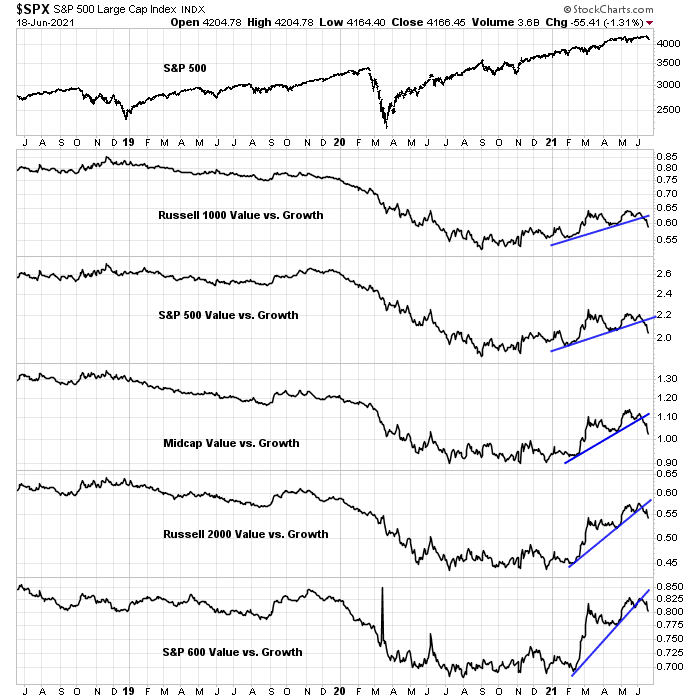
As well, the US market is no longer a monolithic market, but a combination of two markets consisting of growth and value stocks. Each market marches to the beat of its own drummer. The analysis of growth and value across market cap bands shows that growth stocks are dominant, and value is trying to find a relative bottom.
In the wake of the Fed decision, growth stocks, as represented by the NASDAQ 100, advanced to a new all-time high. The NDX to SPX ratio has recovered strongly after rallying out of a relative downtrend.

The relative performance of the Rising Rates ETF (EQRR), which is heavily weighted in cyclical and value stocks, remains in a constructive relative uptrend.

How all this resolves itself depends on the evolution of the 10-year Treasury yield. Here is an interesting thought. If the market reaction to the Fed’s hawkish tone is to flatten the yield curve, which is the bond market’s signal of a slowing economy, doesn’t that imply that the Fed is on the verge of a policy mistake that erroneously slows the economy?
Don’t panic. It’s not the Apocalypse. The market is not about to experience a major risk-off episode.
What’s ahead for gold
In the wake of the Fed announcement, I received a number of questions about the outlook for gold, especially in light of my bullish view (see Interpreting the gold breakout). It’s difficult to make a high-confidence call when markets are moving, but I can make an educated guess. From strictly a chartist’s viewpoint, gold prices are obviously oversold. It is trading at a support zone between two important Fibonacci retracement levels.

Investors can also get some clues from inter-market relationships. Gold is inversely correlated with the USD, and it is highly correlated with real rates, as represented by the TIPS bond ETF (TIP). While there appears to have been panic selling gold, TIP has stabilized and began to recover after the Fed decision. On the other hand, the USD continues to exhibit strength (inverted chart).
In all likelihood, gold prices should begin to find a bottom at or about current levels. The prognosis will depend on how gold behaves once prices stabilize and chop around. Watch for positive or negative RSI divergences as it tests the initial lows.
In conclusion, the Fed’s surprising hawkish turn should not be cause for a major risk-off episode in equities. The outlook for gold, however, is less certain because it depends on the market reaction to nominal and real rates and the USD.
Disclosure: Long GDX
Using GLD (stock) and GOLD (commodity):
which one is better? or essentially indifference in reaching the conclusion.
Any value in having GLD and GOLD (commodity) on the same chart?
A few things are emerging from my weekly momentum update that have a reasonable associated narrative.
Healthcare ETF had a great week and is now outperforming. Seems reasonable with Obamacare surviving the Supreme Court challenge. It is in the Defensive sector. IHI Medical Devices is a personal favorite and it has woken up.
High Quality Factor ETFs in the US (SPHQ) and international (DNL) are becoming leaders. Makes sense since I look upon Quality Factor as a mixture of Growth and Value. We may be in that stage of the Tactical Factor Rotation in the stock market from Value to Growth.
I don’t trust the Innovative Growth rebound and I’m willing to give Resource Value some slack since we could be early in a commodity supercycle where confidence is still low.
The shining star in the Resources is Lithium ETF LIT. it is about half mining and half green technology. It’s doing much better than ICLN in both the Value AND the Growth outperformance periods.
Please.note these are not recommendations since I don’t know your personal circumstances.
An effective correction/ pause requires a bona fide ‘scare.’ Last week didn’t seem to be it. So the two most likely scenarios are a return to new highs (let’s say 4400) followed by a real correction, or a decline to at least 4057 (probably lower) before the rally resumes.
Chief Economist of Moody’s Analytics Mark Zandi sees a 10-20% correction that may already be under way due to more hawkish Fed. He does not expect a quick recovery post correction.
His thoughts are based on inflation being higher than the market is expecting.
Place your bets. The croupier is about to spin the roulette.
Nice call on SPY this morning, Cam. Given that the intraday gain is already >the average 5-day return in Deppe’s analysis, are you inclined to take profits today?
Closing SPY after hours.
Reopening a position in TLT after hours.
Good read.
https://www.marketwatch.com/story/to-roth-or-not-to-roth-part-ii-11624039585?mod=mw_latestnews
Reopening positions in EEM/ FXI.
Adding to TLT.
KRE.
COIN.
Closing COIN here.
Closing the tranche of TLT opened this morning here.
Closing all remaining positions here.
NIO.
Adding a second tranche to NIO.
Reopening TLT.
All positions off here.
Ended up being on OK day despite the early pullback in TLT.
Reopening a position in TLT.
Closing TLT. I think we’ll see a better entry later today.
Reopening TLT on strength.
Adding to TLT.
Bad trade today. Out.