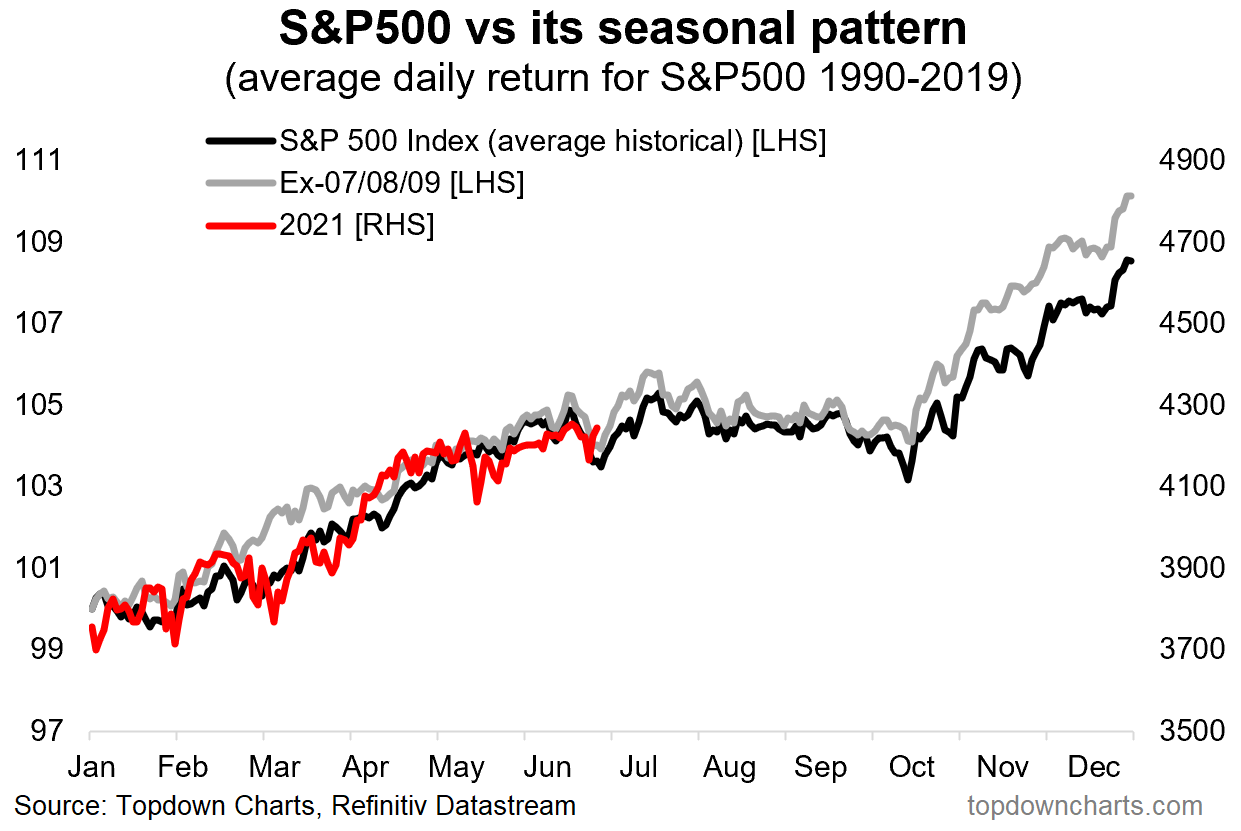
Mid-week market update: The S&P 500 has shown negative seasonality at the end of June. So far, the index has been tracking its historical pattern well in 2021. The market took fright last week from the abrupt hawkish tone of the FOMC statement and subsequent Powell press conference last week. By Friday, it had become deeply oversold (see Boo! Powell scares the children!) and recovered this week.
Was that it? Is the seasonal weakness over?
A broad recovery
The analysis of the top five sectors tells the story. As a reminder, the top five sectors account for about three-quarters of the S&P 500 index weight, and it would be difficult for the market to significantly move up or down without a majority of their participation. The relative performance of the top five sectors shows that all sectors except Financials have exhibited positive relative strength. To be sure, these sectors tend to be FANG+ dominated, which argues for a revival of growth leadership. Nevertheless, sector breadth is supportive of more market strength.

Taking a quick tour around the world, we can also see a rebound in Europe. Both the Euro STOXX 50 and the FTSE 100 have held above their 50 dma and both have recovered.

Over in Asia, Japan has rebounded.

The markets of China and her major Asian trading partners have been the global laggards. The Shanghai Index has rebounded. Hong Kong and Singapore are trading below their 50 dma and may be exhibiting bearish trends, but the region has been holding up well overall.

In short, US and global breadth can be characterized as neutral to bullish. Does that mean all is right with the bulls?
Key risks
Not so fast. The NASDAQ 100 achieved a fresh all-time high while exhibiting a negative RSI divergence.

The S&P 500 is testing its previous highs while exhibiting a similar negative RSI divergence. As well, both NYSE and NASDAQ breadth are showing a bearish pattern of lower highs.

Selected sentiment readings are also flashing warning signs. Bearish sentiment from the Investors Intelligence survey has fallen to historic lows. Is this a sign of bearish capitulation that precedes a selloff?

Resolving the bull and bear cases
Here is how I resolve the bull and bear cases. The market reached an oversold extreme late last week and staged a relief rally. My monitor of the Zweig Breadth Thrust Indicator is instructive. As a reminder, a ZBT buy signal is triggered when the market reaches an oversold condition and rebounds to an overbought reading within 10 trading days. While the official ZBT Indicator, which is based on NYSE breadth, did not become oversold last week, a proxy using S&P 500 components (bottom panel) did. In the past, the market has always enjoyed a strong rebound whenever my version of the S&P 500 ZBT Indicator became oversold, even when the official ZBT Indicator did not.

That seems to be what is happening now. I am tactically bullish over a 3-5 trading day time frame. However, the combination of sentiment warnings and negative breadth and momentum divergences could combine to keep a lid on stock prices as we move into July.
Stay tuned.
Disclosure: Long SPXL
Cam- your trading window is 3-5 trading days, which based on your change in the trading model on Sunday, ends Friday. But your post yesterday talks about “moving into July”, which is the end of next week. How do you reconcile the difference in time frames?
Thank you.
Email Cam if you do not get a response soon
Taking a swing at GDX here.
AMZN.
TLT.
Taking partial profits in GDX premarket.
Looks like a return to all-time highs for the SPX.
Closing AMZN.
Adding to TLT.
Reopening AMZN.
Adding back to GDX.
Taking the hit on TLT.
Closing AMZN and GDX as well.
Not a great week. When I started trading, bad weeks would leave me upset for several days. After a while, we realize it’s part of the game. A pass interception or being tackled for a 5-yard loss. We just have to be careful not to let oversized positions or lack of discipline take us OUT of the game.
Speaking of (sell) discipline – TLT is now at the intraday low and probably headed even lower.
Taking another shot at TLT here.
Closing TLT here. Still red for the day but nice to end with a green trade.