Preface: Explaining our market timing models
We maintain several market timing models, each with differing time horizons. The “Ultimate Market Timing Model” is a long-term market timing model based on the research outlined in our post, Building the ultimate market timing model. This model tends to generate only a handful of signals each decade.
The Trend Asset Allocation Model is an asset allocation model that applies trend following principles based on the inputs of global stock and commodity price. This model has a shorter time horizon and tends to turn over about 4-6 times a year. The performance and full details of a model portfolio based on the out-of-sample signals of the Trend Model can be found here.

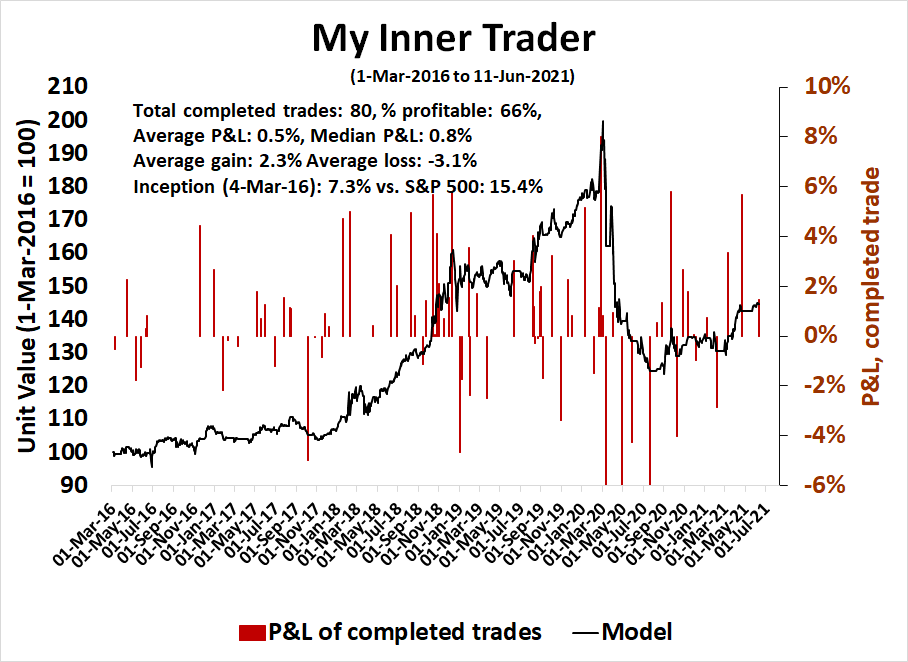
My inner trader uses a trading model, which is a blend of price momentum (is the Trend Model becoming more bullish, or bearish?) and overbought/oversold extremes (don’t buy if the trend is overbought, and vice versa). Subscribers receive real-time alerts of model changes, and a hypothetical trading record of the email alerts is updated weekly here. The hypothetical trading record of the trading model of the real-time alerts that began in March 2016 is shown below.
The latest signals of each model are as follows:
- Ultimate market timing model: Buy equities
- Trend Model signal: Bullish
- Trading model: Neutral
Update schedule: I generally update model readings on my site on weekends and tweet mid-week observations at @humblestudent. Subscribers receive real-time alerts of trading model changes, and a hypothetical trading record of those email alerts is shown here.
Subscribers can access the latest signal in real-time here.
One last high?
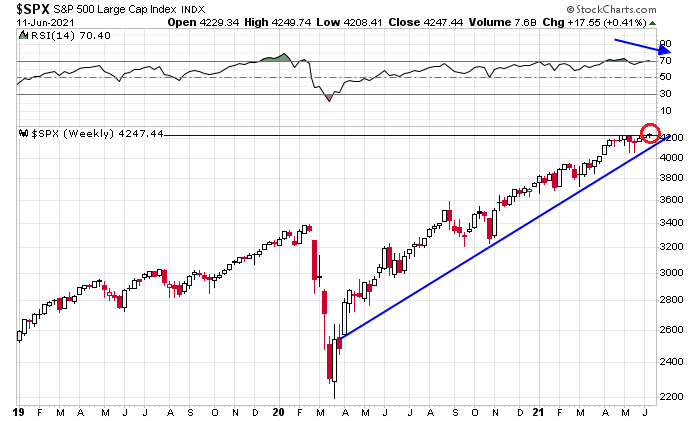
The good news is the S&P 500 rallied to a marginal all-time high last week. The bad news is it was accompanied by a bearish RSI divergence.
There was even more bad news.
Non-confirmations everywhere
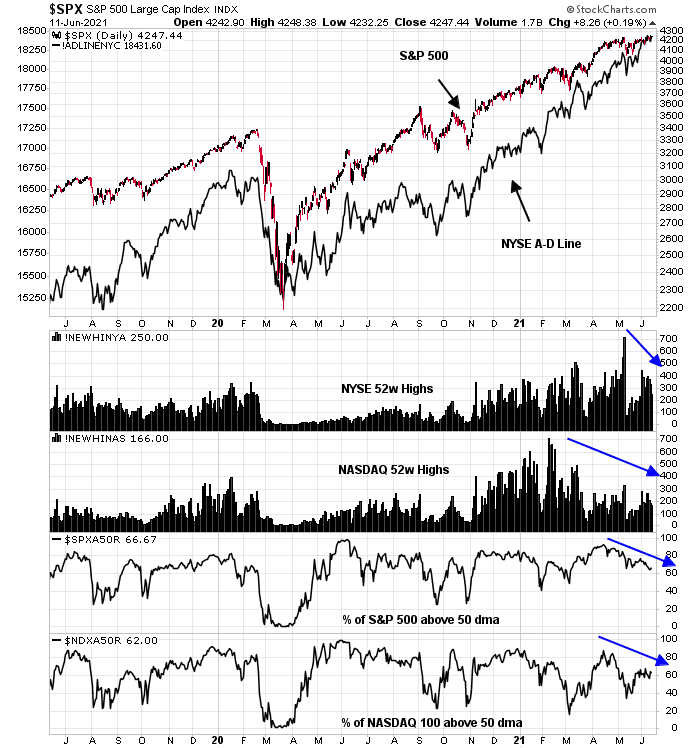
While it is said that there is nothing more bullish than fresh highs, most market internals are not confirming the stock market’s strength. While the NYSE Advance-Decline Line did advance to fresh highs, both NYSE and NASDAQ new 52-week highs are weakening. So are the percentage of S&P 500 and NASDAQ stocks above their 50 dma.
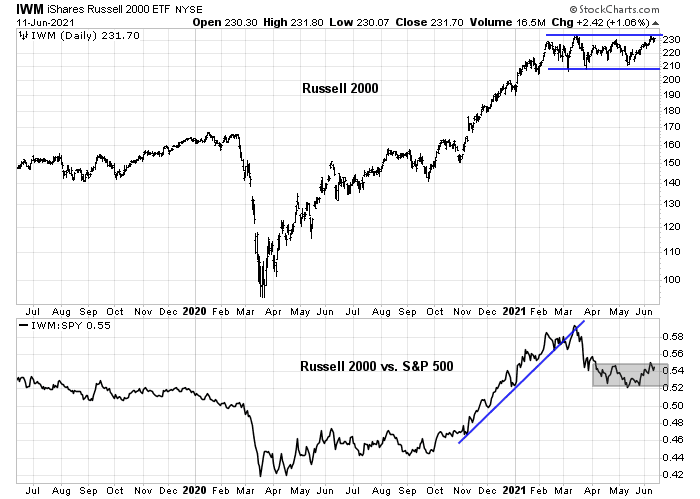
The small-cap Russell 2000 continues to languish in a trading range. As well, small-caps have violated a relative uptrend and they are now trading sideways against the S&P 500.
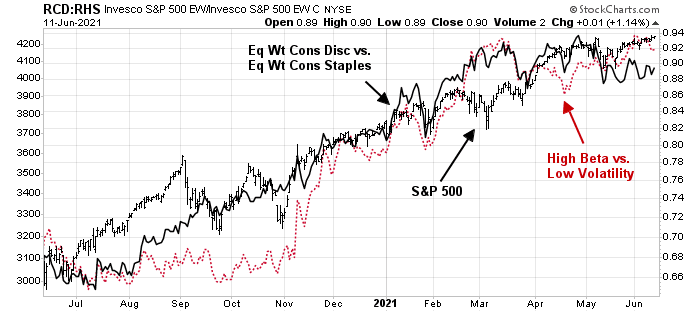
Equity risk appetite, as measured by the equal-weighted performance of consumer discretionary to staples, is exhibiting a strong negative divergence. The ratio of high-beta to low-volatility stocks is showing a minor negative divergence.
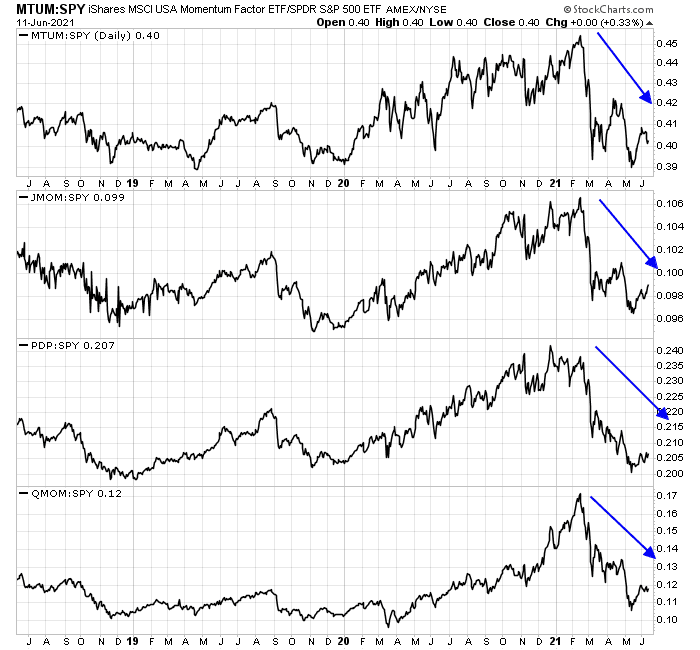
The price momentum factor, however it’s measured, is weak.
Sentiment warnings
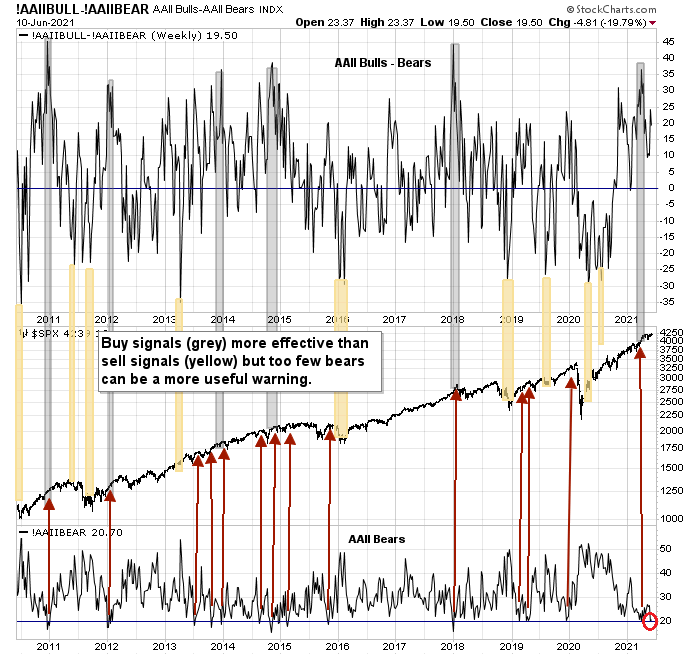
A number of sentiment models are also flashing warnings. The latest update of AAII weekly sentiment shows that bearish sentiment remains at an extremely low level. This has been a cautionary sign for investors in the past.
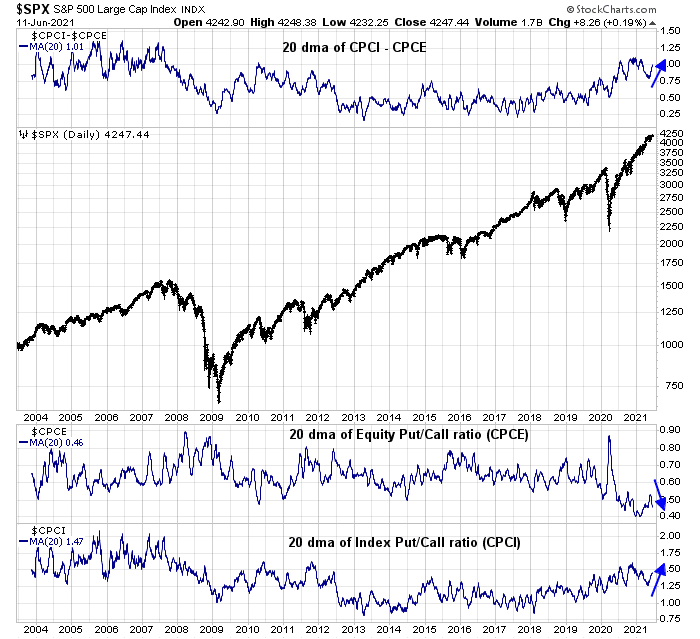
In addition, the equity-only put/call ratio, which is reflective of individual trader activity, is falling and nearing historic lows again. By contrast, the index put/call ratio, which is more reflective of professional hedging activity, is rising.
Sentiment models are inexact timing indicators for calling tops. Nevertheless, the combination of sentiment and technical conditions is warning that the stock market advance is unsustainable. Current conditions call for differing ways of approaching the market, depending on the investor’s time horizon.
Investment-oriented accounts need to recognize that the primary trend is still up. Stay long equities and don’t worry about minor blips in the market.
On the other hand, traders don’t need to be always aggressively long or aggressively short. This is a time to step to the sidelines. My base case scenario calls for a period of sideways and choppy sideways price action. Pullbacks should be relatively shallow and limited to drawdowns of 5% or less.
There is an alternative scenario calling for sp500 to continue to advance, albeit not too aggressively. Now that rotation is back into tech, big techs have the potential to lead again, just like last year when people were complaining about the narrow leadership.
This scenario has decent probability because the hedgies are covering their tech shorts. This invariably will attract algos herding and make the movements more dramatic. This algos herding is characteristic of modern markets. If you are a trader this phenomenon can be your additional alpha. It goes both directions of course and it goes longer than you logically think, just like Farrell’s wisdom.
Several sub-sectors in tech are showing strength. The riskier ARKK just cleared 50, 200 MA last Fri. All we need is for 10Y to not make big moves upward. In other words let’s all be good boys and follow the Fed’s narrative.
Tempted to open a July put here, say 4000.