After a number of discussions with readers, there appears to have been some misunderstanding over my recent post (see The bond market tempts FAIT). I did not mean to imply that the advance in bond prices is an intermediate-term move, only a tactical counter-trend rally. The decline in Treasury yields can be attributable to:
- The market’s buy-in to the Fed’s “transitory inflation” narrative, which was discussed extensively in the post;
- Excessively short positioning by bond market investors, as shown by a JPMorgan Treasury client survey indicating that respondents were highly short duration, or price sensitivity to yield changes; and

- A FOMO stampede by corporate defined-benefit pension plans. A recent study showed that pension plans were nearly fully funded from an actuarial viewpoint. Falling rates would raise the value of liabilities, and without asset-liability matching, pension plans were at risk of widening their funding gap.

In short, the bond market rally is a tactical counter-trend rally. The combination of expansive fiscal and monetary policy will eventually put upward pressure on inflation and bond yields.
That said, there are a number of pockets of uncorrelated opportunities for investors, regardless of how long Treasury yields stay down.
Gold and gold miners
I turned bullish on gold and gold miners about a month ago (see Interpreting the gold breakout). At the time, I pointed out that the initial point and figure target for the Gold Miners ETF (GDX) was 40. Never did I dream that GDX would reach its target within days of the publication of that post.
From a long-term perspective, both gold and GDX had broken out of a multi-month flag formation, which is a bullish continuation pattern and should have further upside potential. From a short-term perspective, both gold and GDX have pulled back and they have been consolidating sideways and GDX is testing the 50% retracement support level. The GDXJ (junior golds) are now outperforming GDX, which is a constructive indication of the return of speculative fever in the group. Look for the group to advance until the % bullish rises into the over 80% overbought zone.

Zooming out to a multi-year view, gold prices staged an upside breakout in mid-2020, pulled back, and it is now testing overhead resistance at 1900. Cross-asset signals are constructive. Real yields, as represented by TIP, are rising. So is the TIP to IEF ratio, which is correlated to the long-term inflation expectations ETF (RINF).

The intermediate-term outlook for gold is bullish and the current bout of weakness should be regarded as a buying opportunity.
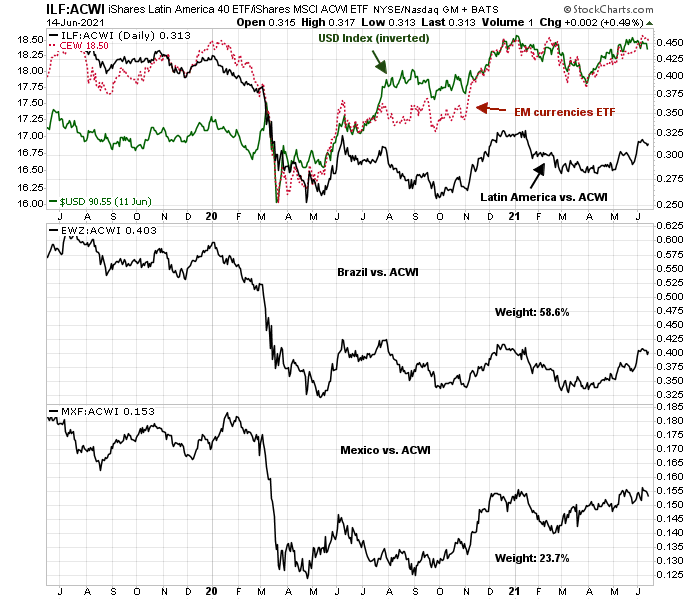
Latin America
If the outlook for gold prices is bullish, then the path of least resistance for the USD should be down, since the two are inversely correlated. In particular, emerging market currencies have been strong against the USD.
While investors could expose themselves to a falling greenback by buying the EM currency ETF (CEW). Another way is through a bet on Latin American equities, whose relative performance has been correlated to EM currencies. Be aware, however, the Latin American region is highly undiversified. The two biggest weights, Brazil and Mexico, make up the bulk of the weight in the index.
In conclusion, the decline in Treasury yields represents a tactical counter-trend move. Nevertheless, there are other uncorrelated investment opportunities beyond the interest rate-related plays. Gold and gold miners are poised for another upleg. Latin American equities may be an overlooked USD-weakness-related play.
Disclosure: Long GDX
Cam: do you see positive momentum for Canadian stocks?
In the short run, EWC is consolidating its gains. Intermediate term momentum should be positive.
What does it mean:
“Falling rates would raise the value of liabilities, and without asset-liability matching, pension plans were at risk of widening their funding gap”.
Thanks.
Future pension benefits are a stream of cash flows. Pension actuaries determine their present value by discounting them back to now. Take the value of assets now and divide by that present value of liabilities and that’s the funding ratio shown in the graph.
When rates rise, there’s more discounting action on cash flows out in the future, so they are worth less now.
If you’re the mathy type, PV = cash flow / (1+I)^t
When I increases, the PV decreases.
The opposite happens when rates fall – the present value of those future benefit payment liabilities goes up. If the value of assets in the pension fund goes up by less, the difference gets bigger, which can be stated in the lingo as a widening of the funding gap.
Actuaries practice “asset liability management” (ALM) to minimize these swings.
Thanks. That makes sense.
Reopening a few positions here. VTV/ TLT/ EEM/ FXI/ PICK.
GDX.