Preface: Explaining our market timing models
We maintain several market timing models, each with differing time horizons. The “Ultimate Market Timing Model” is a long-term market timing model based on the research outlined in our post, Building the ultimate market timing model. This model tends to generate only a handful of signals each decade.
The Trend Asset Allocation Model is an asset allocation model that applies trend following principles based on the inputs of global stock and commodity price. This model has a shorter time horizon and tends to turn over about 4-6 times a year. The performance and full details of a model portfolio based on the out-of-sample signals of the Trend Model can be found here.

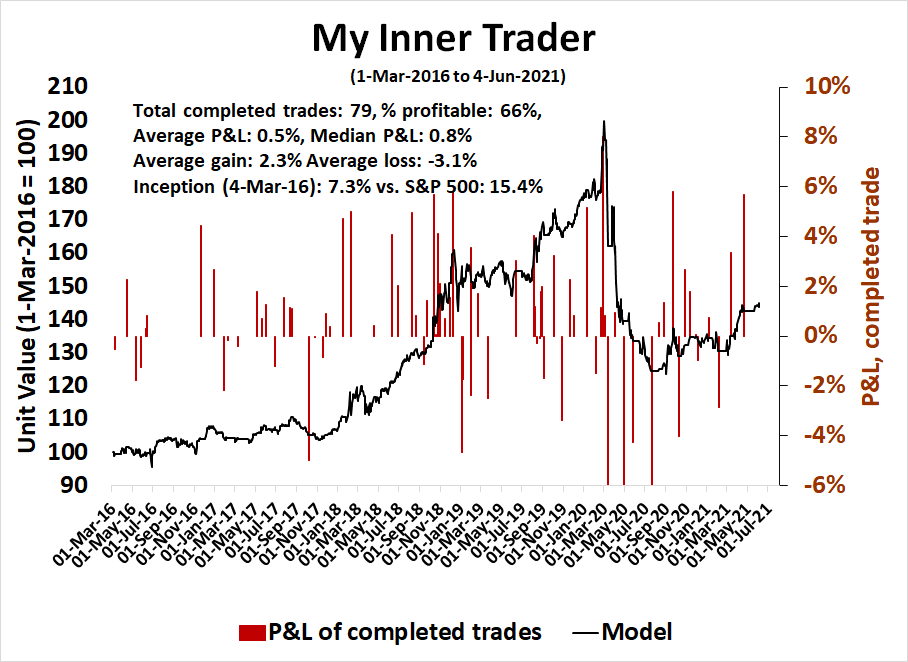
My inner trader uses a trading model, which is a blend of price momentum (is the Trend Model becoming more bullish, or bearish?) and overbought/oversold extremes (don’t buy if the trend is overbought, and vice versa). Subscribers receive real-time alerts of model changes, and a hypothetical trading record of the email alerts is updated weekly here. The hypothetical trading record of the trading model of the real-time alerts that began in March 2016 is shown below.
The latest signals of each model are as follows:
- Ultimate market timing model: Buy equities
- Trend Model signal: Bullish
- Trading model: Bullish
Update schedule: I generally update model readings on my site on weekends and tweet mid-week observations at @humblestudent. Subscribers receive real-time alerts of trading model changes, and a hypothetical trading record of those email alerts is shown here.
Subscribers can access the latest signal in real-time here.
Negative seasonality ahead
While I am not inclined to trade strictly on seasonality, technical conditions agree with the seasonal pattern. If history is any guide, the S&P 500 is scheduled to pause its advance starting about mid-June.
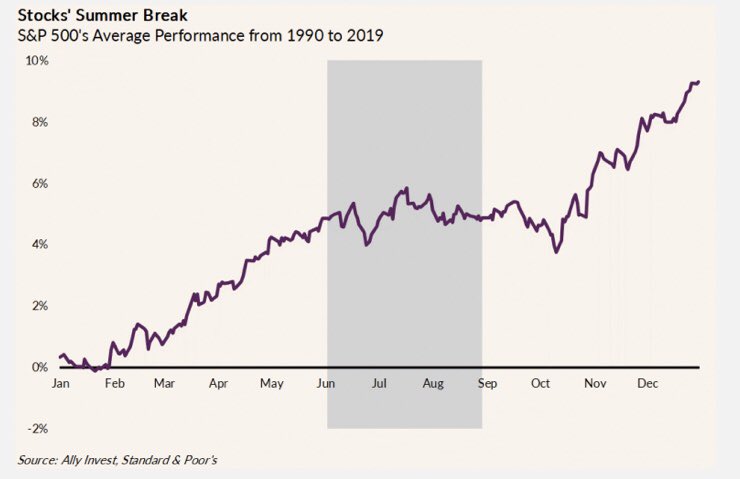
My base case scenario of record calls for the index to test its old high and possibly make a marginal new high, but the time is running out for the bulls. The coming week is the bulls’ last chance to show their strength.
Dark clouds on the horizon
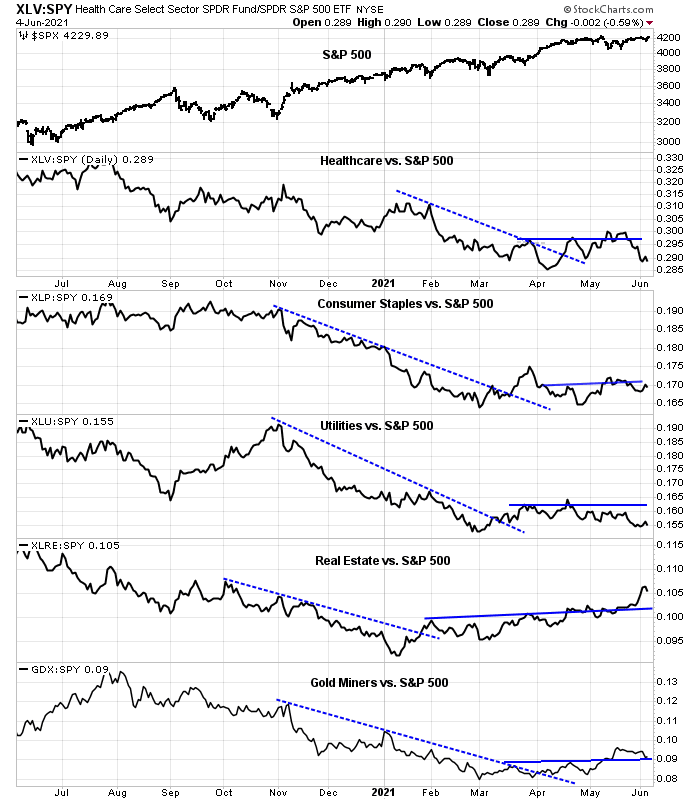
The technical tea leaves are not looking very good. The top five sectors make up about three-quarters of S&P 500 weight and it would be difficult for the index to advance or decline without the participation of a majority. A review of the relative performance of these sectors shows that only one, Financials, can be described as being in a relative uptrend. The rest are either weakening or trading sideways compared to the index.

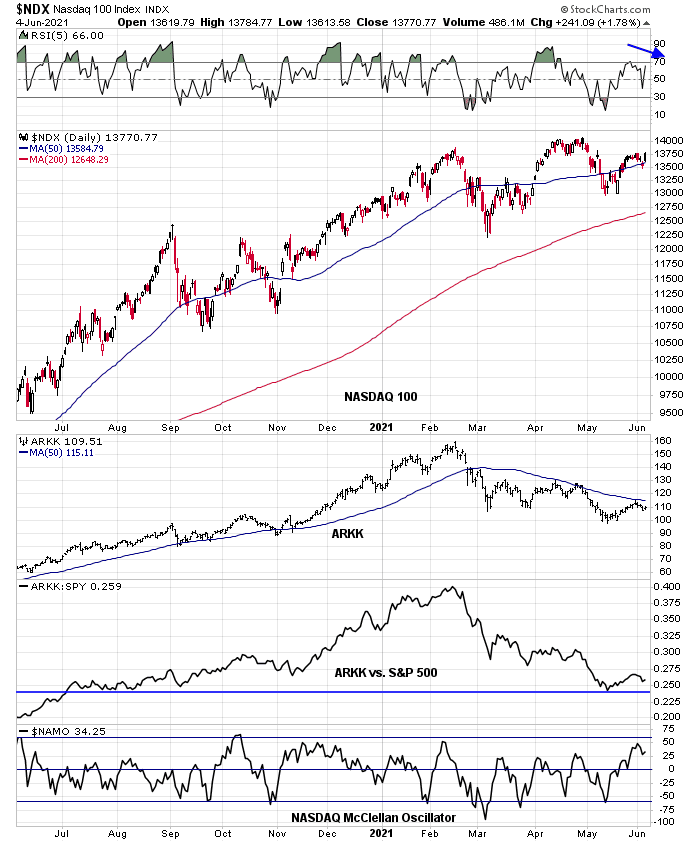
The high-beta NASDAQ 100 is testing resistance while exhibiting a negative 5-day RSI divergence. Speculative growth stocks as represented by ARK Innovation ETF (ARKK) failed at its 50 dma resistance. As well, the NASDAQ 100 McClellan Oscillator reached a near overbought condition before rolling over.
The burst of speculative froth by meme stocks have also marked past trading tops in the past. Here are AMC and GME. Will this time any different? Do you feel lucky?


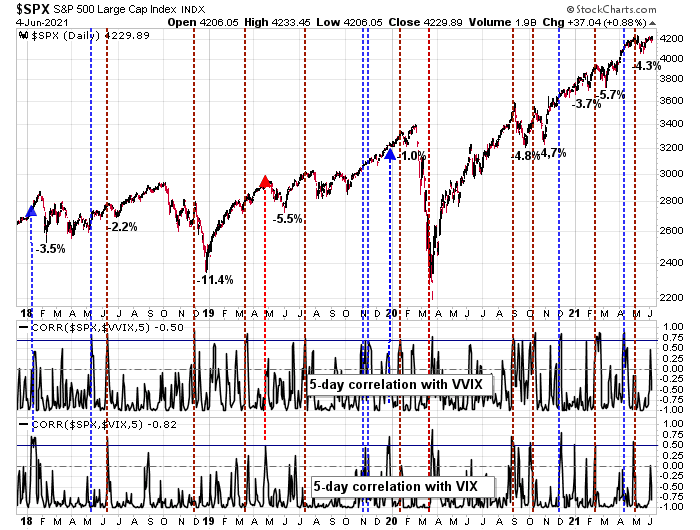
Another warning comes from the spike in the correlation between the S&P 500 and the VIX Index, and the S&P 500 and the VVIX, which is the volatility of the VIX. While readings did not reach sell signal levels, the surge in correlation is nevertheless a warning that the bulls have a narrow window to push prices upward.
Setting tripwires
Here is what I am watching. Can the defensive sectors regain their relative strength in the coming days? If so, it will be a signal that the bears have regained control of the tape.
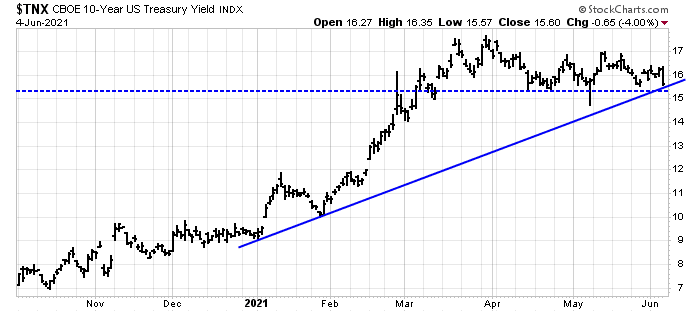
Can the 10-year Treasury yield break down through support. A support break would be a signal of a bond market rally that could lend a second wind to growth stocks (see What a bond market rally could mean for your investments).
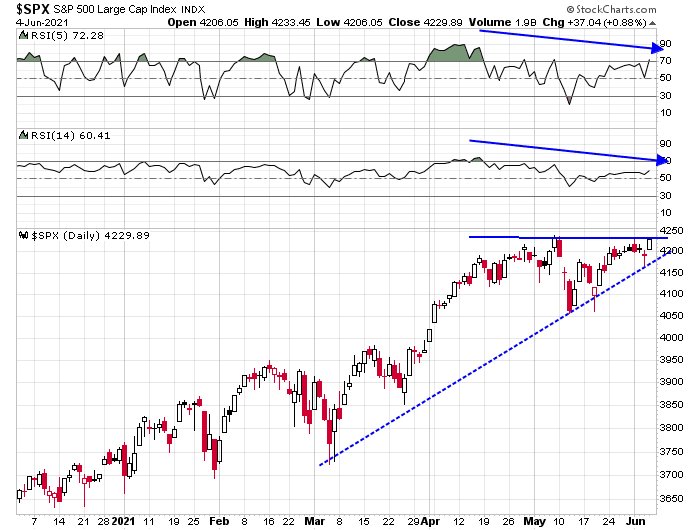
Finally, watch to see if the S&P 500 can break resistance or breach support. The challenge for the bulls is to stage an upside breakout in the face of negative RSI divergences. The challenge for the bears is trend line support in the 4180-4190 range.
Don’t get me wrong. The intermediate-term trend is still up. The market is just due for a pause. My inner investor remains bullishly positioned. My inner trader is getting ready to take profits at a moment’s notice.
Disclosure: Long SPXL
Excellent analysis. Thanks.
Cam,
‘The market is just due for a pause’. Does this suggest choppiness in a trading range or a correction, to be bought?
Thanks
Trading range, possibly a minor pullback of no more than 5%.
Closing the balance of my position in TLT here. Based on the title of Cam’s latest post, it may a good time for a trading holiday.