Several readers asked me to address the valuation warning from Jason Goepfert of SentimenTrader, who found that the S&P 500 is wildly overvalued based on a combination of real earnings yield and dividend yield.
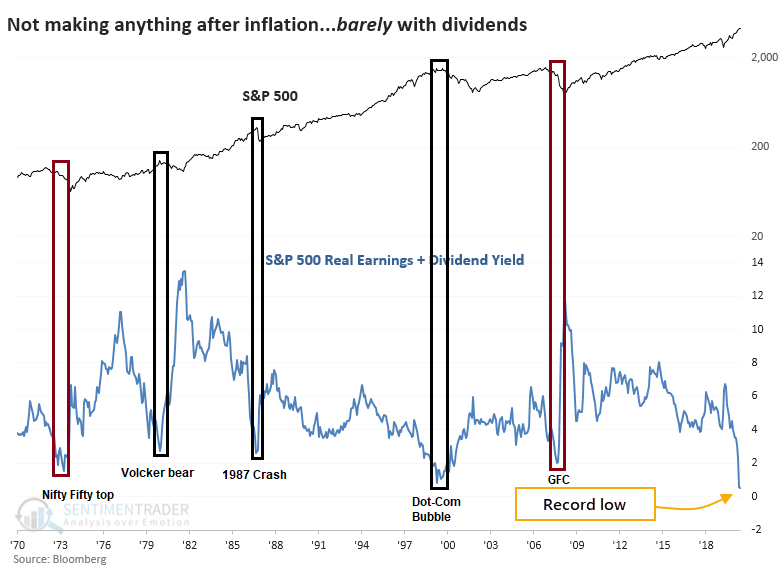
Let’s begin by unpacking Goepfert’s chart (annotations are mine). There were five instances since 1970 when the market appeared overvalued based on this metric. The market had already begun falling in two episodes (red boxes: the Nifty Fifty top and the GFC top), and this indicator signaled tops in three (grey boxes: Volcker induced bear market, 1987 Crash, and the Dot-Com Bubble). Is a success rate of 60% (three out of five top calls) enough for an effective sell signal?
Differences in opinion
I have a difference of opinion over Goepfert’s methodology. First, he uses the inverse of the trailing P/E ratio instead of forward P/E to calculate real earnings yield “because [forward P/E ratios are] nothing but guesses. And Wall Street analysts are notoriously inaccurate at predicting the future.” While the claim that the Street is notoriously inaccurate at predicting the future is correct, the market is a discounting mechanism, and using last reported earnings can lead to valuation distortions, especially when the economy is emerging from a recession.
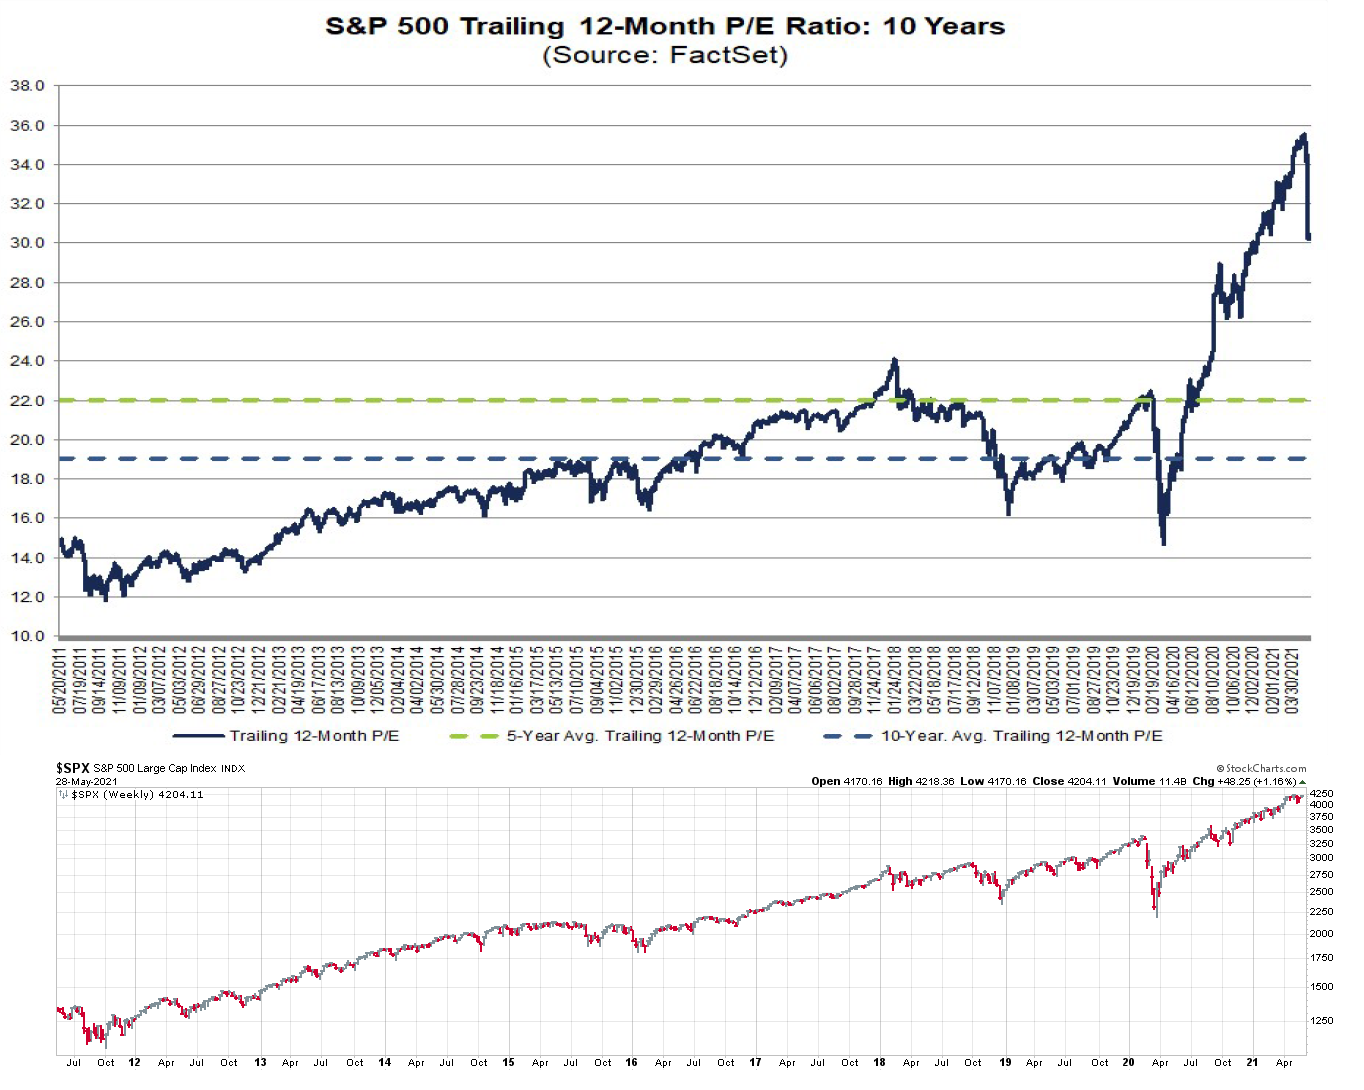
As the chart below shows, trailing 12-month P/E skyrocketed in 2020 as the economy came to a sudden stop because of the pandemic. The S&P 500 rose after a brief setback and never looked back. Does that mean investors should be worried about valuation based on trailing P/E? The answer is no. As the economy began to improve, earnings rose and the trailing P/E fell.
Contrast a similar analysis based on forward P/E. While I recognize that forward earnings estimates are a form of fiction, what matters more to the market is the direction of change and not the absolute level of earnings estimates. Using forward P/E allows investors to be forward-looking instead of backward-looking. The forward P/E ratio has been relatively steady since the recovery from the COVID Crash, indicating that EPS estimates have been rising in line with the market.

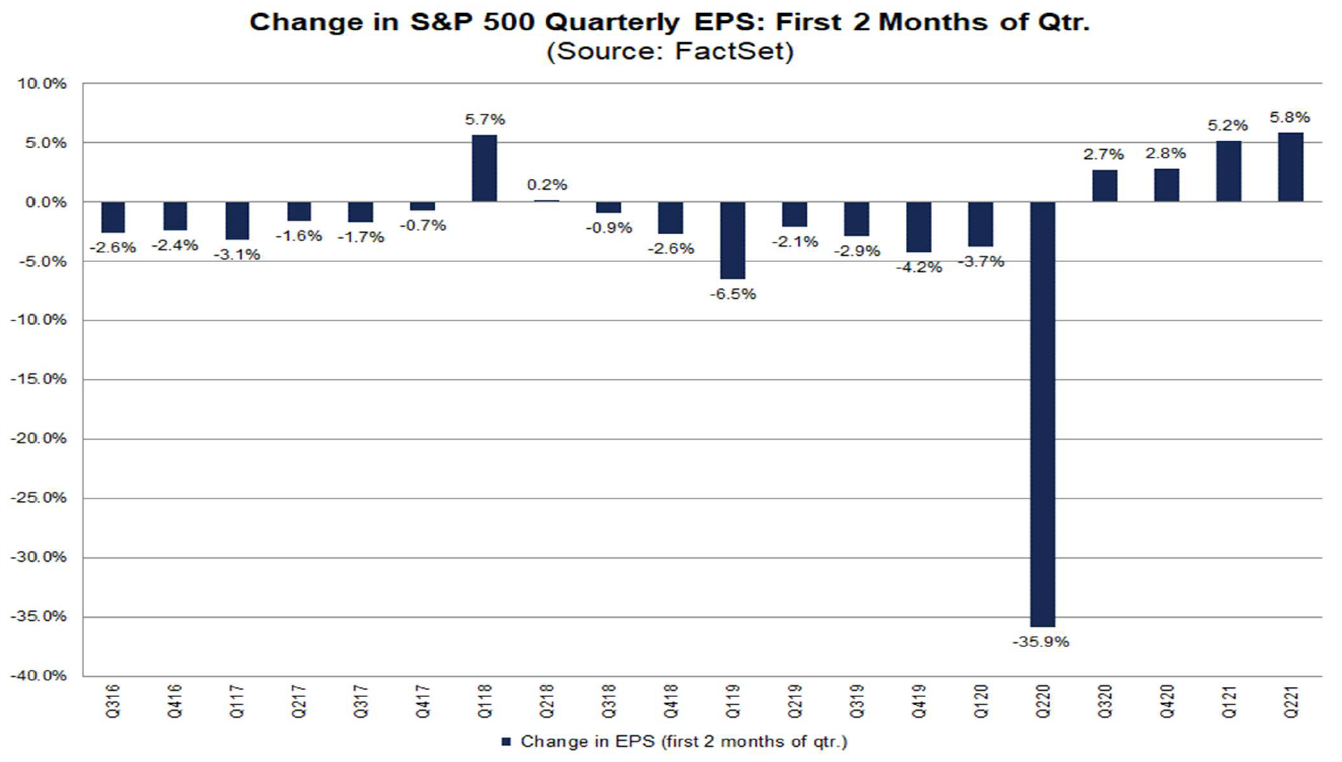
Moreover, the forward 12-month estimates have risen faster than the S&P 500 in recent weeks. The forward P/E ratio fell as a consequence, which improves the valuation picture. FactSet reported that the S&P 500 experienced the largest EPS increase for Q2 to date since 2002, which was the year a new bull market began in the wake of the NASDAQ Crash.
In addition, Goepfert appears to be mixing real inflation-adjusted valuations with nominal returns.
Now that there has been a spike in inflation gauges, the earnings yield on the S&P 500 has turned negative. This is not a condition that investors have had to tackle much over the past 70 years.
When an investor in the S&P adds up her dividend check and share of earnings, then subtracts the loss of purchasing power from inflation, she’s barely coming out even. This is a record low, dating back to 1970, just eclipsing the prior low from March 2000.
If we ignore dividends, then there have been five other times when the S&P 500’s inflation-adjusted earnings yield turned negative. The S&P failed to rally more than 7% at its best point within the next two years after all but one signal.
What is the bear case here? If an investor is using inflation-adjusted valuations, shouldn’t that be benchmarked against real returns, rather than nominal returns? If the bear case is a spike in inflation which acts to depress equity valuations, then what alternative asset classes should the investor consider? To be sure, I have pointed out in the past that many non-US equity markets offer more attractive alternatives than the US (see In search of global opportunities), but the case I made was based on relative performance and not an absolute performance.
In short, Goepfert’s analysis appears to be a case of torturing the data until it talks.
ERP and its variants
Notwithstanding Goepfert’s insight, other analysts have highlighted variations of a bearish inflation-adjusted earnings yield valuation thesis. In differing ways, these are all different applications of the Fed Model, which measures the spread between the E/P ratio and interest rates, otherwise known as the Equity Risk Premium (ERP).
Morgan Stanley pointed out that an inflation-adjusted equity risk premium, which is the forward earnings to price yield minus a 10-year breakeven rate, has fallen to lows last seen at the height of the NASDAQ top.

Michal Stupavsky of Conseq Investment Management also observed that the S&P 500 inflation-adjusted earnings yield (without dividends) has set a 40-year low.

Bullish interpretations
There are, however, more benign interpretations of ERP. If investors were to compare the S&P 500 earnings yield minus the BBB real yield, which reflects the corporate cost of capital, valuations appear to be more benign. Arguably, the market looks slightly cheap if measured this way.

Aswath Damodaran, finance academic at the NYU Stern School, has maintained an ERP model based on nominal equity and bond yields. His latest update shows a reading of 4.24%, which is approximately the level seen at the market’s 2009 bottom.

Jurrien Timmer at Fidelity Investments calculated a market valuation based on price to total cash, which is the dividend yield plus buyback yield. He concluded, “By this metric, the market looks reasonably priced, right in line with where it was at the same points during the 1949-68 and 1982-2000 secular bull markets.”

Inflation and Fed policy
How can we resolve this valuation debate? Is the stock market about to keel over and crash?
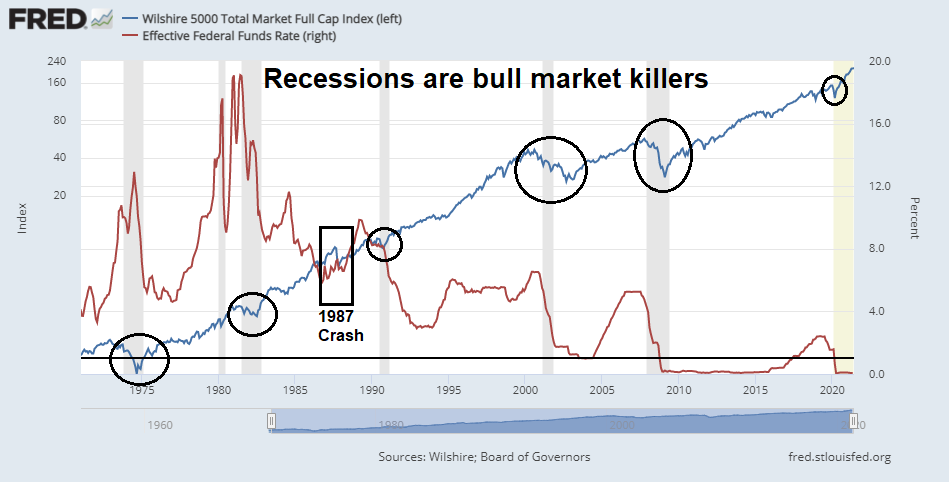
For some historical perspective, bear markets are caused by recessions. Of the five instances that Jason Goepfert originally cited, only the 1987 Crash was sparked by excessive valuation. In all cases except for the COVID Crash, the recessions were caused by the Fed tightening monetary policy.
The global economy just emerged from a massive recession. What are the chances that central banks tighten to cool off overheated economies? BCA Research pointed out that the Fed rate hike came two years after the last QE taper. Various Fed speakers have started to discuss how the Fed may taper its QE program. Market expectations indicate that a taper will begin either late this year or early next year. If the Fed were to follow the script of the post-GFC era, rate hikes won’t begin until late 2023 or 2024.

Much depends on the Fed’s reaction function to inflation data. So far, the Fed has dismissed the surge in prices as transitory. Core CPI and Core PCE came in hot at 3.0% and 3.1% respectively. On the other hand, the Dallas Fed’s Trimmed Mean PCE, which excludes outlying components, is relatively benign at 1.8%.

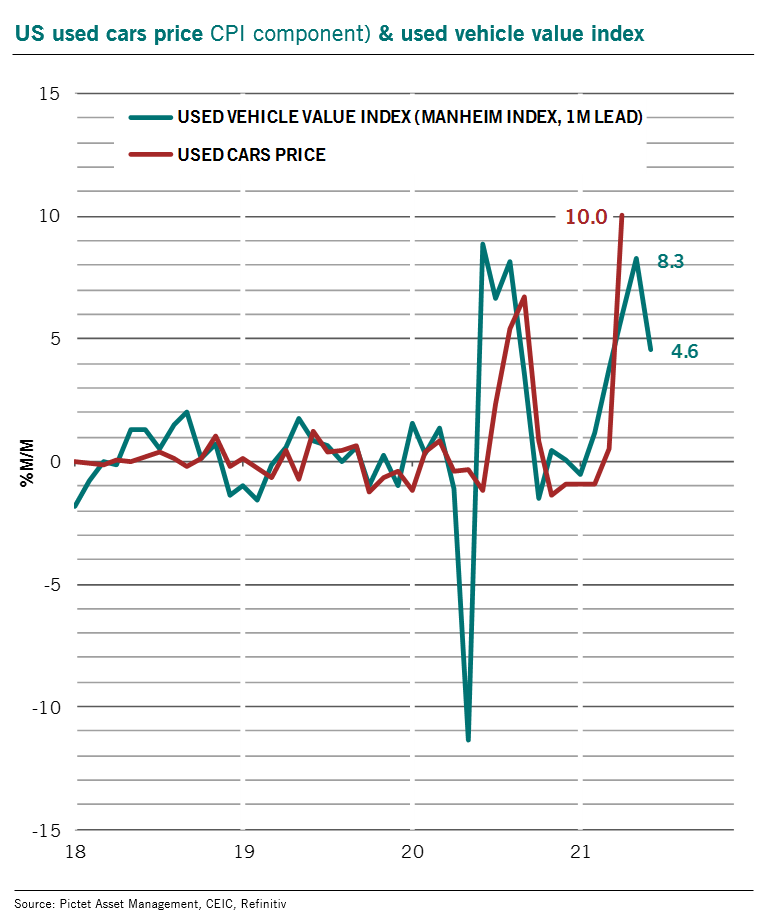
There is a case to be made that the recent price spikes are indeed transitory. Used car prices, which is one element of price increases that have driven the inflation surge, are showing signs of deceleration.
The Fed is determined to run a hot economy. The prospect of rate increases is far on the horizon, especially in light of two soft consecutive Non-Farm Payroll reports.
Bullish momentum
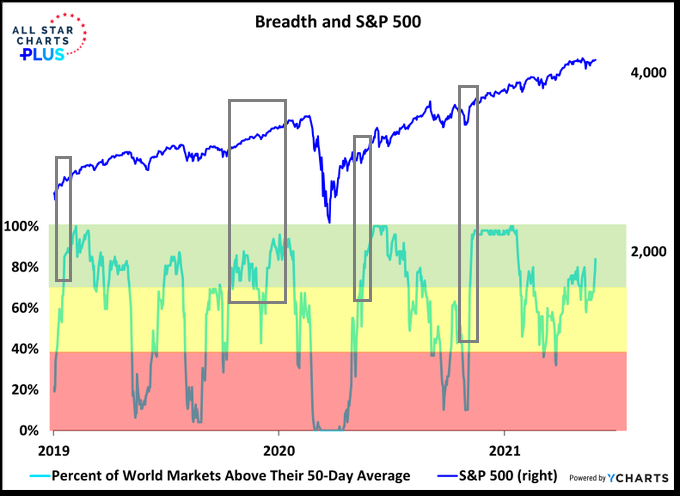
From a technical perspective, Willie Delwiche observed that 86% of global markets are above their 50 dma, indicating strong breadth and positive price momentum. While this does not mean that the market is going up in a straight line, similar past signals have been intermediate-term bullish for the S&P 500.
In conclusion, the fears of a valuation-induced market crash are overblown. Recessions are bull market killers, and there is no sight of a recession on the horizon. Fed policy is accommodative and it is expected to be easy for some time. While I have made the case before that US investors could find better bargains outside America’s borders (see In search of global opportunities), this does not mean that the S&P 500 will experience a bear market in the near future.
This is a bull market. Enjoy it.
Great counter-argument to Goepfert’s warning, Cam. Always a pleasure to read what amounts to new and unconventional ways of looking at things.
With the market up so much from last year’s low, experts eagerly offer opinions on why it’s too high. Those experts that conclude stocks are reasonably priced whisper their opinions. Bob Shiller, the most quoted valuation index maker came out with a revised index that shows markets are relatively cheap when he included low interest rates. His previous Shiller Index said we were at a rare bubble peak. Since he came out with the new research, it’s almost impossible to find it or see updates while the old research is constantly quoted and shown.
Apart from that, I once again get back to how Growth and Value have diverged so much in the last five years especially the 2020 Covid lockdown. It could be these scary valuation calculations could be true of Growth stocks and very likely on Innovative Growth. But Value is truly cheap. So mixing the two together is absurd. For example, JP Morgan is at twelve times earnings while the ARK ETF group is near a hundred. Mix those two together and tell me where the combined pair will go over the next year. One is based on economics and the other on sentiment.
The other important experience I can share is regarding cyclical Value stock markets and stocks. We Canadians have lived with an economically sensitive Index forever. Financials, mining and energy make up over 50% of our index. The S&P Index has much less than twenty.
NEWS FLASH! Covid Canadianized your growthy index. Things from Denny’s to REITs became cyclical.
Here is how Canadians have learned to invest in cyclical markets and stocks. We love it when a recession sends earnings down and PEs through the roof. In fact the best time to by many is when the PE is infinite when a company or industry is losing money. Early in the new economic upturn we know analysts will underestimate the recovery and have to revise earning up constantly as they are surprised. This is especially true of American analysts who don’t have Canadian experience and are analysing companies in their group that have never been as cyclical as this past year. Also, companies that go though a big scare become more efficient and this also will boost earning’s surprises.
Years later when earnings are high on cyclical companies, PEs are low and they are gleefully raising dividends, we know to sell them when Central Bankers start to take away the punch bowl.
That is investing Canadian style 101.
I think this “time is different, but also the same”. We are in a global sovereign debt problem. When was the last time that happened?
When was our last pandemic?
We have increased prices, but unless you are from outer space, you noticed some lockdowns. So how sticky will these prices be?
Housing means jobs, but more importantly it is a big credit expansion…they don’t want to snuff it.
The debt does not make it comfy to raise rates.
When do we get inflation, dunno? But in 10 years when they have printed 100 trillion to cover medicare, social security, pension plans public and private…yeah we should have some.
So this is why I think they are buying stocks. Because in the long run, they will be worth more than now. But there will be shakeouts. Keep an eye on bond spreads
I agree we are in a bull market right now. However, from a longer term perspective what can we expect in three to five years regarding interest rate and inflation? Any thoughts? It looks like we can find some opportunities in value stocks across different countries that remain attractive even with earnings discounted at more “normal” rates
Buy Value and non-US. Not saying that you will lose money holding the S&P 500, but there are better opportunities elsewhere.
Thanks
Correction: Dallas Fed Trimmed Mean PCE is 1.8%, not 1.9%. Changes in the text have been made to reflect the correction.
Housing makes up 33% of the Inflation index and their methodology has YOY housing inflation at about 2% when home prices are up at least 12%. This has been going on for years and makes CPI a very flawed index.
They phone up homeowners and ask what they think they can rent their homes for. Absurd. They should monitor real rents for rental properties and real home prices and then calculate on the basis of how many people rent or own.
Absolutely correct, Ken. The inflation is so much higher than those Gov numbers. Here in Silicon Valley the recent home price increase is just eye-popping. A few decades ago there is reverse gentrification as whites moved out and Hispanics moved in. Now gentrification is back again. This time it is Asians in and Latinos out. I think it is happening in all CA metro areas. Gov is happy that property tax rev is way up. Now Gov can have many more freebies for the poor. So if you are poor just stay put. Good stuff is coming for you. If you are in the middle just accept that you are the milk cows and always blindly vote D, like women enjoying domestic violence.
Oakland started recently UBI, but only for blacks. No other skin colors may apply for it. State Gov just established a study group for reparation for none other than blacks. How about something for Chinese and Japanese? How about the poor early Italian and Irish immigrants?
I see a crisis in CA unfolding. Everything is sky high in price. Yet public unions keep on getting good stuff on the back of middle incomers. Interesting times.