Preface: Explaining our market timing models
We maintain several market timing models, each with differing time horizons. The “Ultimate Market Timing Model” is a long-term market timing model based on the research outlined in our post, Building the ultimate market timing model. This model tends to generate only a handful of signals each decade.
The Trend Asset Allocation Model is an asset allocation model that applies trend following principles based on the inputs of global stock and commodity price. This model has a shorter time horizon and tends to turn over about 4-6 times a year. The performance and full details of a model portfolio based on the out-of-sample signals of the Trend Model can be found here.

My inner trader uses a trading model, which is a blend of price momentum (is the Trend Model becoming more bullish, or bearish?) and overbought/oversold extremes (don’t buy if the trend is overbought, and vice versa). Subscribers receive real-time alerts of model changes, and a hypothetical trading record of the email alerts is updated weekly here. The hypothetical trading record of the trading model of the real-time alerts that began in March 2016 is shown below.


The latest signals of each model are as follows:
- Ultimate market timing model: Buy equities
- Trend Model signal: Bullish
- Trading model: Neutral
Update schedule: I generally update model readings on my site on weekends and tweet mid-week observations at @humblestudent. Subscribers receive real-time alerts of trading model changes, and a hypothetical trading record of those email alerts is shown here.
Subscribers can access the latest signal in real-time here.
A lack of panic
The stock market tumbled last Wednesday on inflation fears from an unexpected “hot” CPI report. It became oversold and rebounded. That bottom seemed a little too easy. The nagging question is, “Where’s the fear?”
While a number of technical indicators became oversold, sentiment models did not show any signs of panic or the sort of seller capitulation usually found at bottoms.
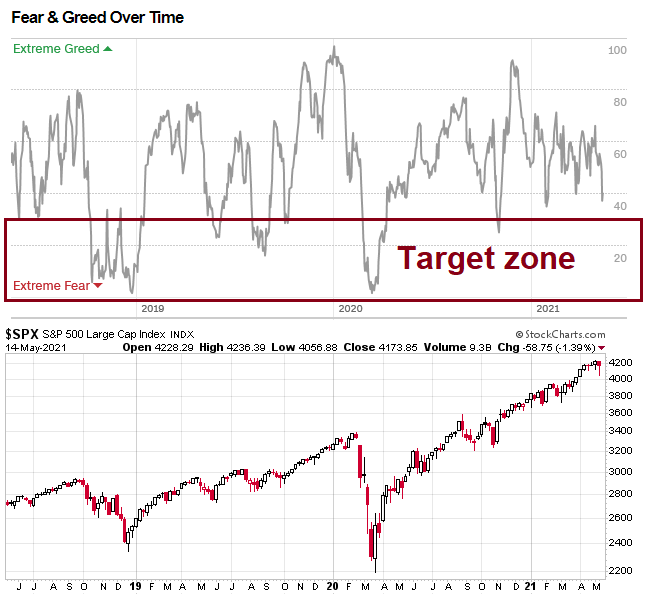
Exhibit A is the bottoming model that I have shown in the past (see The bears take control). While the technical analysis components are flashing oversold signals, the one component that is lacking is a lack of panic. The term structure of the VIX Index hasn’t inverted.
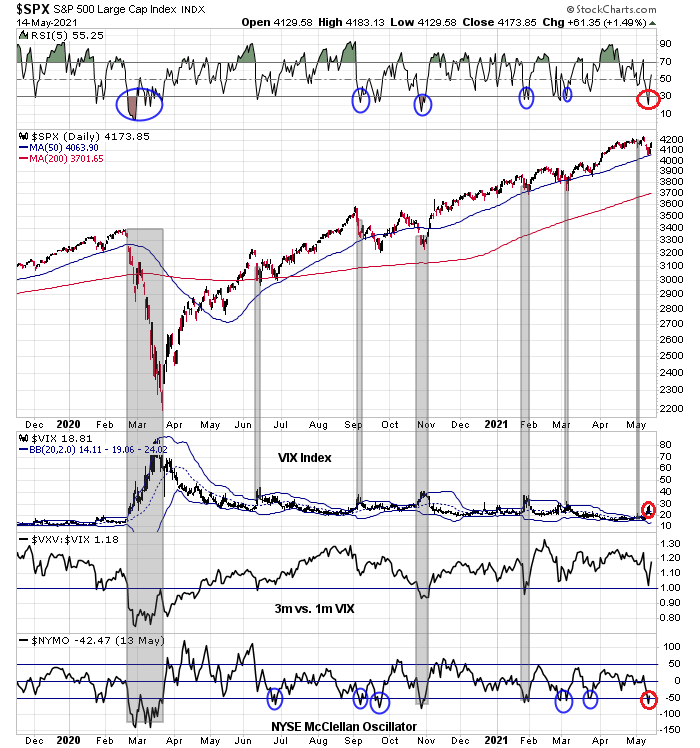
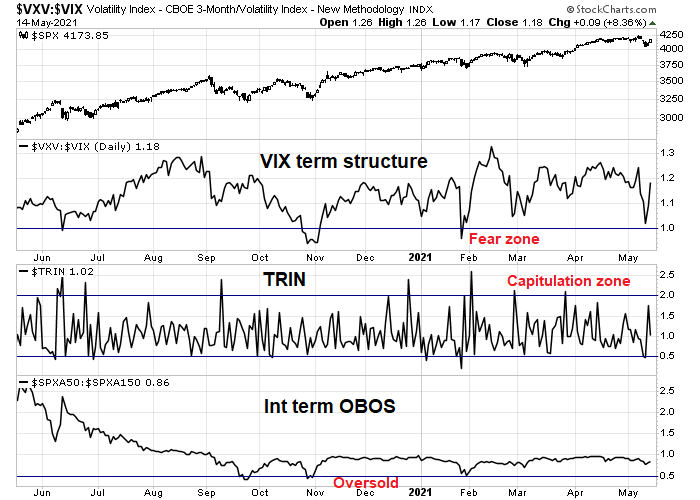
My Trifecta Bottom Spotting Model, which relies more on real-time sentiment indicators and also uses the VIX term structure, is nowhere near a buy signal. The intermediate-term overbought/oversold model is not oversold. The VIX term structure isn’t inverted, indicating rising fear. TRIN hasn’t spiked above 2, which is usually the sign of a “margin clerk” involuntary liquidation.
Positioning vs. opinion
While the tactical trading signals have been wavering, one intermediate-term sentiment model flashed a buy signal. The NAAIM Exposure Index, which measures the RIA sentiment, fell below its 26-week BB. In the past, this has been a strong buy signal which has indicated relatively limited downside risk. According to this sentiment model, the bottom is close, though it can’t spot the exact day.
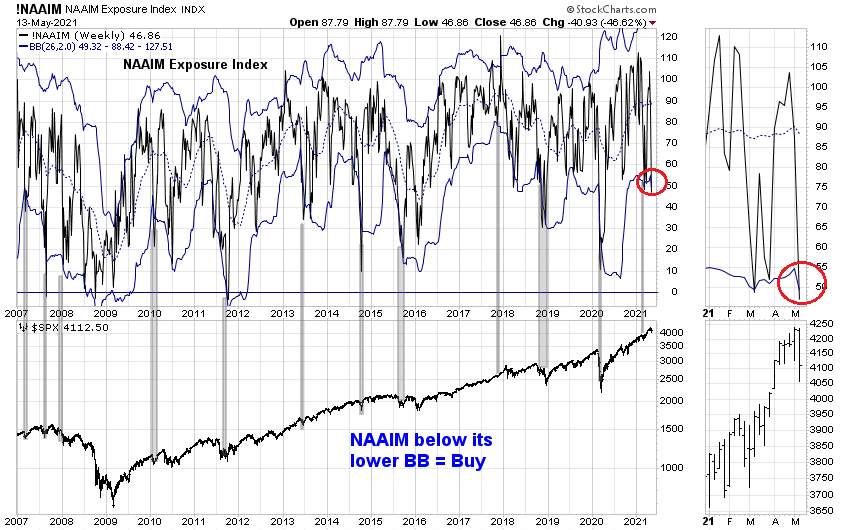
However, I am inclined to slightly discount the bullish conclusion from the NAAIM readings as it is an opinion survey, while the other sentiment models are price-based that reflect the actual deployment of funds. Here’s why. Estimates of equity positioning has come off the boil, though levels remain elevated.

On the other hand, opinions have been jittery. Mark Hulbert observed that his survey of NASDAQ market timers have fallen dramatically, but levels are not yet at the oversold buy signal territory.
The sentiment picture that the recent data are painting shows the market timers to be trigger-happy. They are quick to jump on the bullish bandwagon when the market rallies, and then jump on the bearish bandwagon when the market declines. As a result, both rallies and declines tend to be short-lived.
A longer-lasting rally will require more extreme bearishness among the market timers, and for them to stubbornly hold onto their bearishness in the wake of the rally’s initial liftoff. Except for that to happen, the market to itself most likely would have to suffer a worse decline than we’ve experienced in recent days. In the meantime, enjoy this rally — while it lasts.

The “value” port in the storm
I had previously indicated that value stocks are likely to outperform and they should be regarded as a port in a storm should the stock market weaken. That analysis turned out to be correct as the Russell 1000 Value Index has beaten the Russell 1000 Growth Index. Even though large-cap growth stocks have decisively violated a key support level, value stocks broke down through a rising trend line. This is an indication of technical damage that can’t be shrugged off.

The small-cap picture is similarly discouraging. While small-cap value has strongly outperformed growth, the Russell 2000 Value Index has also violated a rising trend line indicating a parallel picture of technical damage.

The technical damage is also evident in the price action of defensive sectors. Despite the rallies of Thursday and Friday, defensive sectors are holding their relative breakouts against the S&P 500. This is another sign that the bulls haven’t fully seized control of the tape.

Wait for the retest
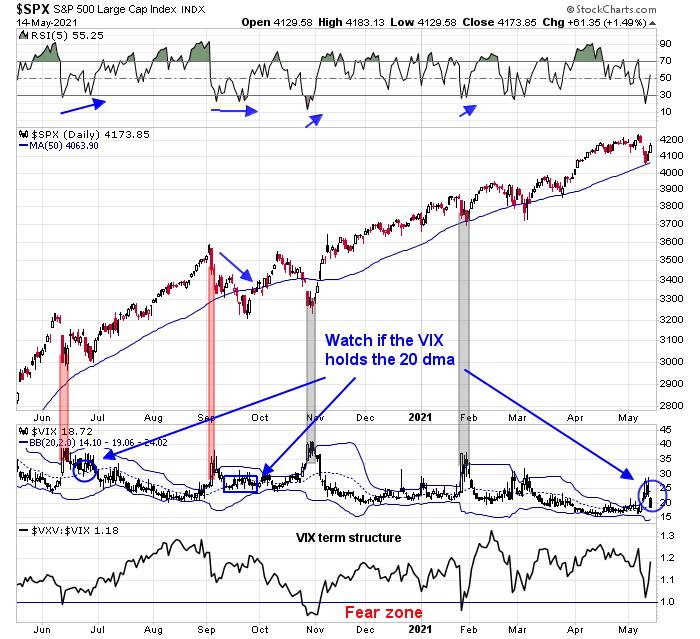
I interpret these conditions as a sign that the market is likely to retest last Wednesday’s lows in the coming weeks. The S&P 500 reached an oversold condition on Wednesday and staged a relief rally. At the same time, the VIX Index spiked above its upper Bollinger Band (BB), which also indicates an oversold market, and recycled. A template for coming weeks may be the experiences of last June and last September when the VIX recycled below its upper BB as the S&P 500 chopped around and dropped to retest its old low. Keep an eye on the VIX Index. If it has difficulty falling below its 20 dma on the way to the lower BB, the chances are good that the market is destined for another test of last week’s lows.
While I am keeping an open mind as to the possibilities of both bullish and bearish outcomes, my inclination is to be cautious. The reflex rallies late last week left both the S&P 500 and NASDAQ 100 overbought on a short-term basis. While anything is possible, it’s difficult to envisage further bullish follow-through early next week that can further weaken the VIX Index below its 20 dma.


Next week is option expiry (OpEx) week. While OpEx weeks have normally seen upward price pressure, the historical evidence is May OpEx is one of the weaker months on a seasonal basis.

Ed Clissold of Ned Davis Research updated his estimate of the S&P 500 seasonal pattern, which calls for a market low in late May. In light of my reservations about the lack of capitulation, that historical template sounds about right.

In conclusion, the stock market is recovering from an oversold position, but sufficient technical damage has been inflicted to cast doubt that it can stage a V-shaped recovery. Look for a retest of the previous lows in the coming weeks and watch for signs of capitulation and positive technical divergences as signals of a possible tradable bottom. Otherwise, watch for the VIX Index to decisively fall below its 20 dma, which would translate to a bullish outlook for equities.
Some thoughts about where stocks are heading;
Here is a chart of the Russell 2000 Small Cap ETF IWM
https://refini.tv/3foopfu
Small caps have been the best performers by far since the Vaccine TWIST. They have stalled since mid-March. They are currently battling two forces, the jump in interest rates since mid-February (hurts small cap growth stocks) and also last weeks worse than expected inflation number (margin pressure on small cap value companies)
On the chart, I put in upper and lower boundary lines at the recent highs and lows. If we break above (on a closing basis), that tells me investors are shrugging off the bad news and small caps (and the market in general) are starting a new powerful up-leg. If we fall below, we are heading for a deeper (10% type) correction.
I’ll bet anyone a dollar that we are heading up.
Keep the chart (it updates daily) and let’s see.
https://www.sfgate.com/politics/article/2021-05-California-mask-mandate-CDC-vaccinated-new-16177861.php
Yeah, can’t happen soon enough. A few of my colleagues made a trip to Hawaii and noted how packed it is at all the venues and beaches.
Getting worried about uptick in cases, in about 4-8 weeks.
Here is an interesting tweet:
“In just TWO weeks, #InstitutionalInvestors cut their #equity #exposures from 103% to 47%. While not a #correction low, it is low enough to suggest we may see a decent bounce into a bigger #selloff mid-summer.”
https://mobile.twitter.com/LanceRoberts/status/1393543002665230344
I never thought that Institutional Investors could module their equity exposure in such a short window.
This is not about institutional investors. NAAIM: National Association of Active Investment Managers. Note the word “Active.” Yes they have sold tons of high flying (some not so high flying) names: semi, software, cloud, cyber security, solar, clean energy, etc., basically everything that moved in the recent past and are considered expensive (in terms of PE; but PEG is conveniently neglected). Portion of them are reduction in positions. Others are outright naked short selling by hedgies.
It is worthwhile to watch for mean reversion in these areas for trading opportunities. Some of the names are potential future big winners. If you are willing to buy and hold some of these names, the timing is good now.
A most interesting day for precious metals and miners (SILJ up 6.5%). Up significantly while both equities and bitcoin are down.
I wonder if some of the bitcoin money is now rotating to precious metals.
I never dreamed that GDX would get to the 40 measured P&F target this quickly.
FYI – Some other technicians I follow and trust are projecting gold to reach as high as $2,200 in coming MONTHS and GDXJ/SILJ to gain as much as 75%-100% during that period.
I think this political development out of Chile adds to the narrative of the bull in copper.
https://financialpost.com/pmn/business-pmn/politics-are-turning-against-copper-mining-in-top-producer-chile
Given the pandemic that caused hardships and widened inequalities, it is probably inevitable that this story of resource nationalism will repeat in other jurisdictions. Maybe safer to stay in developed markets, whenever possible.
This should be bullish for copper overall.
What is a good Indian ETF to buy. Cases are receding and this is a time to buy IMHO.
https://www.cnbc.com/id/106884412?view=story
For every $ purchase of Crypto, shouldn’t there be a party that takes the opposite end of the transaction (= seller)?
Are the two parties who transact this business anonymous?
https://twitter.com/garyblack00/status/1394758241951834117
Gary is making a good argument. Given the environmental concerns brought front and center by Musk, it may be hard for large businesses to justify owning Bitcoins given the ESG issues.
Of course, Bitcoin is very volatile and therefore not a stable store of value.
Maybe the gold and silver run has just started.
Looking for a breach of last Thursday’s low ~4057. Even so, it would probably take a move below 4000 before we see real fear.
https://www.marketwatch.com/story/jack-bogles-ghost-warns-about-401-k-s-11621432396?mod=mw_latestnews
A good read re realistic expectations, IMO.
Based on market internals, 5 day RSI not below 30, CNN Fear & Greed Index only at 31, volume not peaking, VIX not inverted, VIX not above the 2 SD Bollinger Band, $NYMO only at -13, it appears this correction has a way to run before we see a bottom.