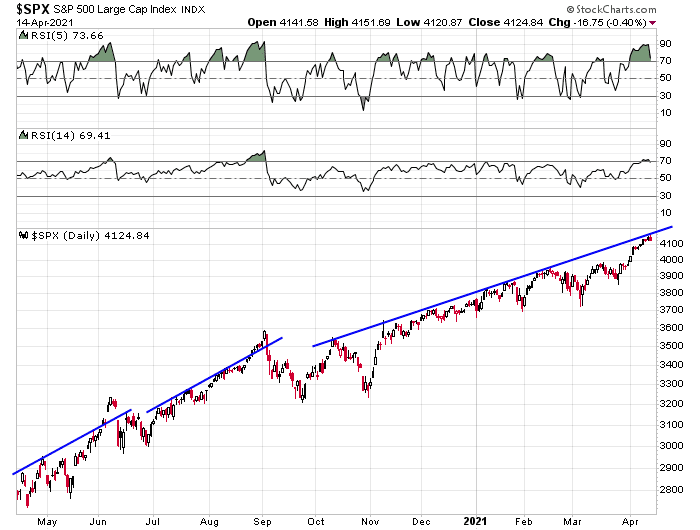
Mid-week market update: Even as selected sentiment models and market internals scream for caution, the S&P 500 is on the verge of melting up as it tests overhead resistance as defined by a rising trend line. The melt-up condition would be confirmed if the index were to rally through the trend line, which it did on two other occasions in the past 12 months. In that case, the regular trading rulebook goes out the window.
The possible market melt-up can be seen more clearly on the weekly S&P 500 chart. The index is potentially spending two consecutive weeks above its weekly upper Bollinger Band (BB). Past instances of upper BB violations have signaled steady advances that usually terminated with a blow-off top, followed by a sharp sell-off. The most impressive upper BB ride in recent memory occurred in late 2017 and early 2018. That episode lasted about four months.
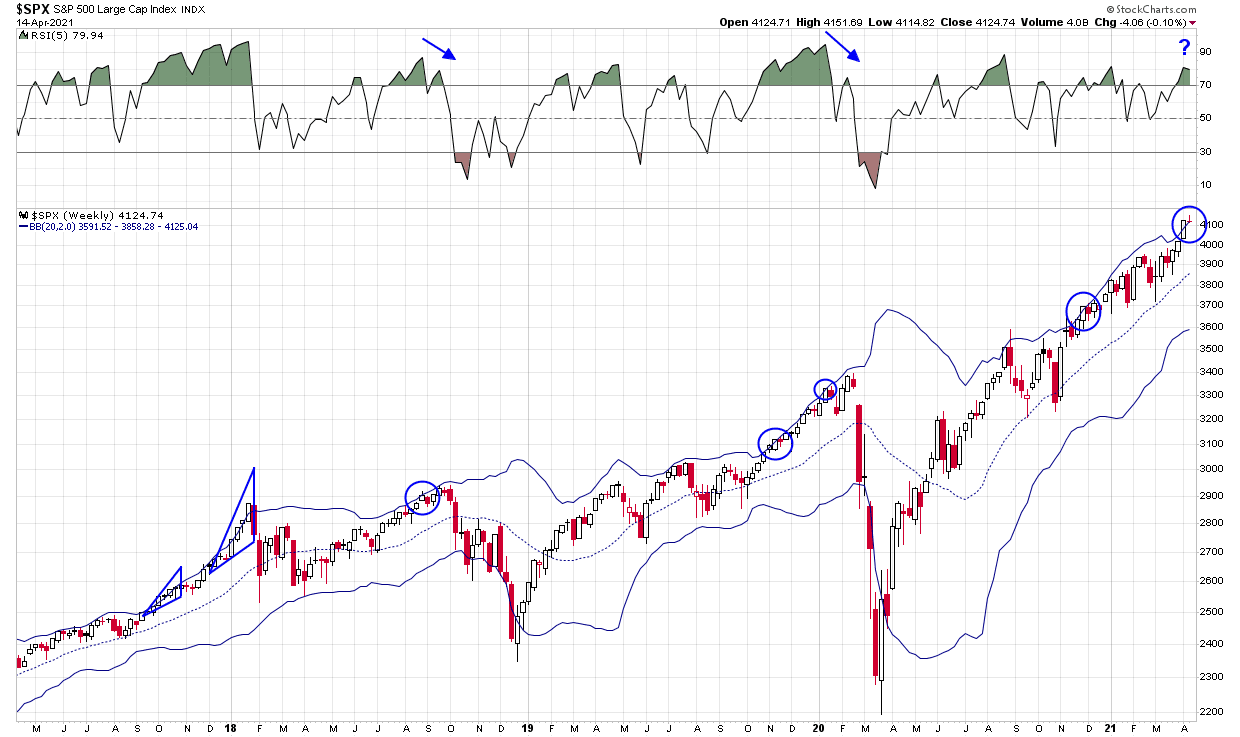
When the animal spirits run, you just don’t know where it all ends.
Warning signals
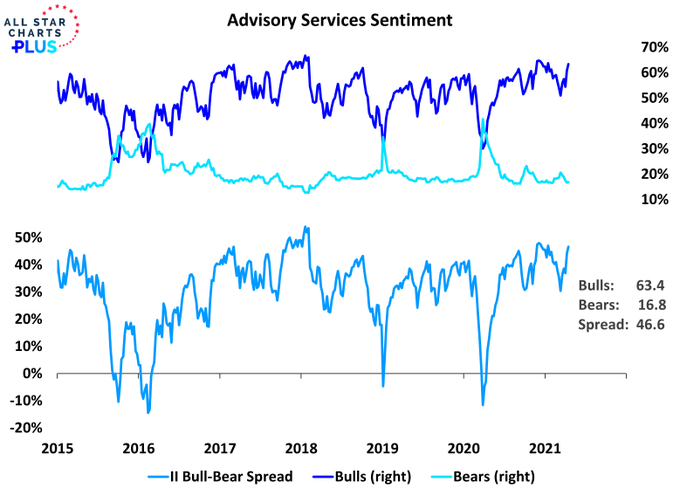
Overbought advances are accompanied by technical warnings, and the current episode is no exception. Sentiment is extended, as evidenced by the high level of bullishness on the Investors Intelligence survey.
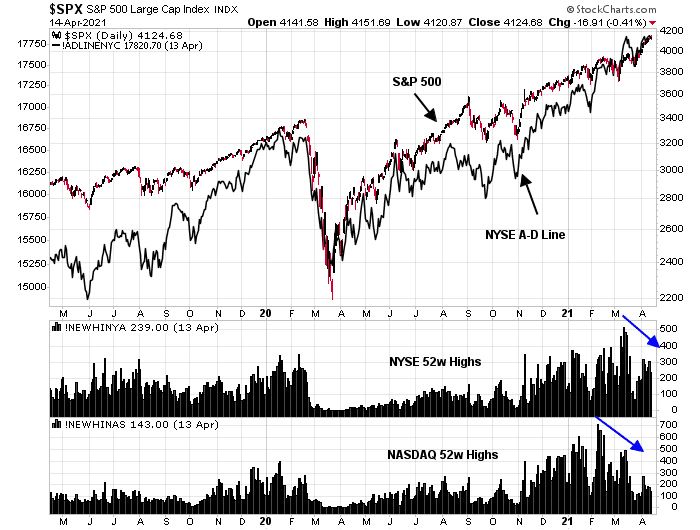
Market breadth presents a weakish picture of market internals. Both NYSE and NASDAQ new 52-week highs have been falling even as the S&P 500 advanced. Moreover, the NYSE Advance-Decline Line had been lagging the S&P 500, though the A-D Line finally made a marginal all-time high this week.
A healthy rotation
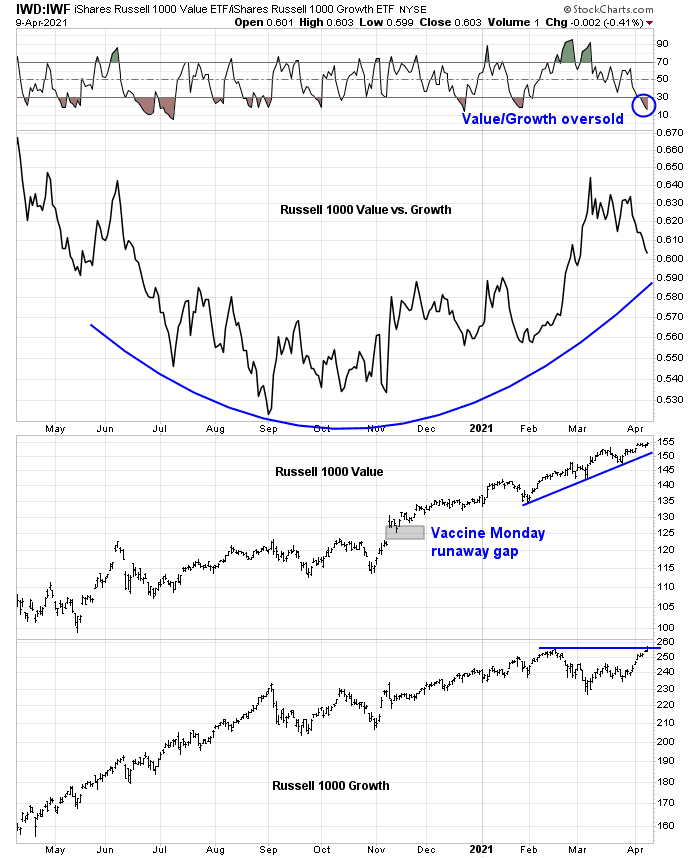
On the other hand, the market has undergone a healthy rotation beneath the surface even as the S&P 500 rose to fresh highs. Value stocks peaked out relative to growth stocks in early March and growth stocks have been the leaders since then. The Value/Growth ratio became oversold on the 5-day RSI and the ratio has since recycled off the oversold condition. This is evidence of a rolling internal correction that can be supportive of further market advances. The risk is a disorderly bullish stampede that leads to a blow-off top and a sharp sell-off.
In conclusion, the market is undergoing a possible market melt-up. Volatility is likely to explode in the coming weeks, either on the upside or the downside, and perhaps both. Daily volatility will be exacerbated by the earnings reports of the day. Several large banks reported today, and they all beat expectations. While earnings were enhanced by the release of excessive reserve provisions that banks took last year as the pandemic cratered the economy, each of the banks impressively beat top-line expectations.
My inner investor is bullishly positioned as he believes the intermediate-term trend is up. My inner trader is long and hanging on, but he is maintaining trailing stops to control his risk.
It’s going to be a wild ride.
Disclosure: Long IJS
VIX and VIX futures are slowly creeping higher. The trader who made a large bet with VIX between 25-40 before July, may be right.
https://twitter.com/ukarlewitz/status/1382052699223379969?s=20
We may be looking at a megaphone pattern developing here, all the way down to 3700.
COIN trader higher this morning, and may be one barometer of ‘animal spirits.’
My focus today is on gold/miners and bonds. The only two sectors where sentiment is about as negative as it gets.
However, I’m not averse to playing a melt-up scenario given good entries and a strong tape.
Staking out early restarters in QS/ PLTR/ NIO/ VIAC/ IQ – all last exited Wednesday morning. The single greatest edge when day trading is the ability to approach the market each morning free of baggage/ bias – at least with regard to intraday positions.
A decent entry has materialized in QS.
Nice action in GDX and TLT. For a change.
COIN ~337. Pure casino action.
Scaling back into XLE.
Scaling back into KRE.
Scaling back into XLF and JETS.
Flipping ST shares out of QS. Will continue to hold a core position at these levels.
AA.
IJS.
FXI.
Scaling back into VTV/ XLI.
Scaling back into IWM,
Reopening a position in RYRHX (Rydex Russell 2000) at the 730 window.
X.
GDX and TLT picking up momentum. A real change in character!
I like the despair that must be settling in for QS holders – not saying this is a bottom, but I’m sure more than a few of them are throwing in the towel here.
Setting in.
Normally I would be cutting losses on stocks like NIO/ QS/ PLTR/ VIAC/ IQ – but I’m beginning to think they’re pretty decent LT holds here.
I plan to close positions in RYGBX (Rydex Long Bond) and RYPMX (Rydex Precious Metals) end of day – both positions have already exceeded my targets for the trade. Sized @ 16.5% each, the trade easily puts me back at all-time highs.
Will be holding all other positions overnight.
Closing AA on the +3.4% after-hours spike.
Blow off tops typically imply just that: The upside game is ending. Coinbase is the latest wildly over valued IPO. The rest of Bitcoin space decline with the the IPO price.
So, help me understand, why is there a rally in Ten year notes today?
If markets are rallying because of strong economy, shouldn’t the TNX be selling here? What am I missing?
Sales are not up that much based on this. This means more stimulus, more policy accommodation, and hence gold is rallying and bonds are higher as well, depressing yields (may be).
Bonds are way oversold.
“The counter-intuitive move in the Treasury market has become a catalyst unto itself, as many traders are positioned for rates to go up, not down. Accordingly, there is ample reason to think that the move in the Treasury market today has been fueled by short-covering activity.”
https://www.briefing.com/
True. I was going to short the TNX, but glad that I did not. That said, we are at the bottom of the channel on the ten year yield, and the next move should see a sell off. See Carter Worth on Twitter.
https://kimblechartingsolutions.com/2021/04/will-historic-selloff-in-treasury-bonds-turn-into-opportunity/
Some are expecting 10-year to drop to as low as 1.2% in coming months.
Nothing goes up or down in a straight line. This is probably just a countertrend rally.
Agreed. The most violent rallies are countertrend.
Great call Cam. How far do you think this could go?
I think Cam’s initial target was ~4160. Early indications are for an open ~4172.
Reducing exposure premarket. Closing positions in IWM, XLF, and FXI.
Closing X.
Paring back on QS.
Closing IJS.
Closing KRE.
Closing VTV.
Closing XLE.
Opening a position in RIOT.
Reopening XLE/ IJS.
Reopening KRE.
Closing RIOT.
RYRHX (Rydex Russell 2000) was closed at the 730 window.
All positions off here.
Back to 100% cash.
Taking losses on a few of the flyers, but overall it was one of my better weeks.
This feels like there is more room to run….