Preface: Explaining our market timing models
We maintain several market timing models, each with differing time horizons. The “Ultimate Market Timing Model” is a long-term market timing model based on the research outlined in our post, Building the ultimate market timing model. This model tends to generate only a handful of signals each decade.
The Trend Asset Allocation Model is an asset allocation model which applies trend following principles based on the inputs of global stock and commodity price. This model has a shorter time horizon and tends to turn over about 4-6 times a year. In essence, it seeks to answer the question, “Is the trend in the global economy expansion (bullish) or contraction (bearish)?”
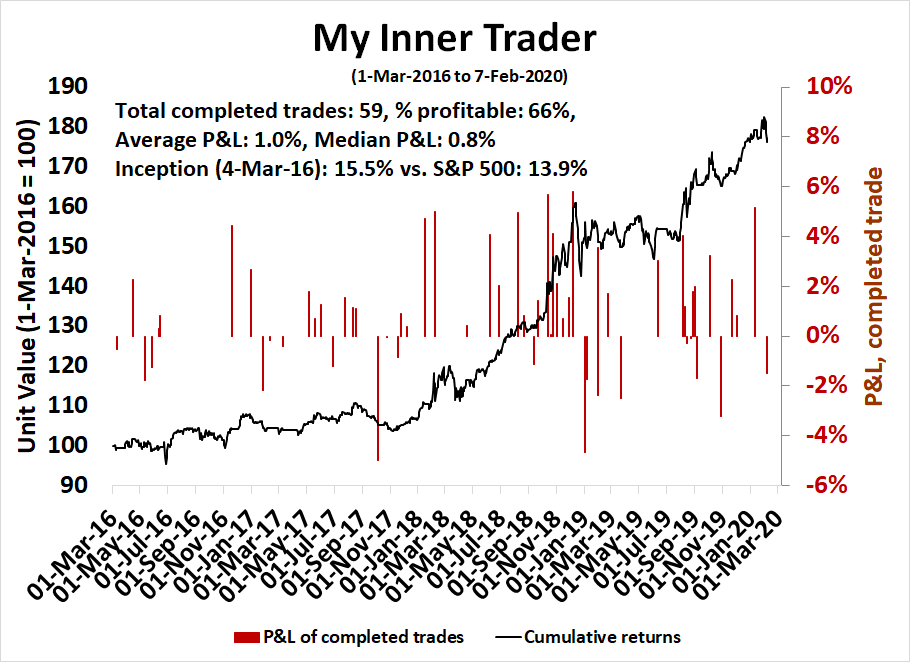
My inner trader uses a trading model, which is a blend of price momentum (is the Trend Model becoming more bullish, or bearish?) and overbought/oversold extremes (don’t buy if the trend is overbought, and vice versa). Subscribers receive real-time alerts of model changes, and a hypothetical trading record of the those email alerts are updated weekly here. The hypothetical trading record of the trading model of the real-time alerts that began in March 2016 is shown below.
The latest signals of each model are as follows:
- Ultimate market timing model: Buy equities
- Trend Model signal: Neutral
- Trading model: Bullish
Update schedule: I generally update model readings on my site on weekends and tweet mid-week observations at @humblestudent. Subscribers receive real-time alerts of trading model changes, and a hypothetical trading record of the those email alerts is shown here.
Is sentiment too bullish?
Mark Hulbert warned about excessively bullish sentiment leading to a market decline in a Marketwatch column on February 1, 2020. At the time, Hulbert wrote that he would like to see bullish sentiment to retreat and the Wall of Worry to rebuild.
It would be a good sign if they rush to the sidelines and then quickly jump onto the bearish bandwagon. In contrast, it would be a bad sign if they stubbornly hold onto their bullishness in the wake of the decline. In that case, contrarians would expect that an even deeper correction would be necessary to rebuild the Wall of Worry that would support a new leg upwards.
The market did fall briefly, but rallied in the face of massive PBOC market support. In a follow-up column last week, Hulbert issued a second warning about excessive bullishness. His Hulbert Stock Newsletter Sentiment Index fell, but rose again into the top 80% of bullishness. Such readings have historically been resolved with subpar returns over a 1-3 month time frame.
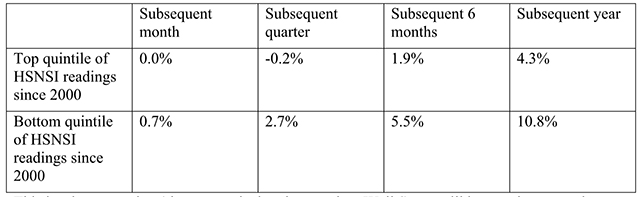
The stock market advance appears to be unsustainable on an intermediate term basis, but even Hulbert’s analysis shows a return of 0.0% over one month, which is hardly a wildly bearish forecast. The bigger question is, how vulnerable is the market in the short run?
It would be very easy to turn tactically bearish here, but let us turn conventional technical and sentiment analysis on its head. It is entirely possible that we are undergoing a period where sentiment resets briefly, and stock prices rally to even more highs as pictured by my green annotated periods.

How vulnerable is the market? Has sentiment reset sufficiently for the market to make another run at fresh highs?
A “sort of” sentiment reset
It depends on what you mean by sentiment. Survey based sentiment models and market priced based sentiment models are telling very different stories.
One of the most useful measures of trader sentiment is the rather unscientific Callum Thomas weekend Twitter sentiment survey. Last week’s survey showed the second lowest level of bullishness in the short history of the survey. Preliminary results indicate that the extreme level of bearishness has considerably moderated.

My own sentiment models, which are mainly based on market based and technical data, tell a different story. Fear levels, as measured by option trading, have spiked. In the past, market tops, which are shown in shaded grey, have seen at least one of the five models flash warning signs. Today we have none.
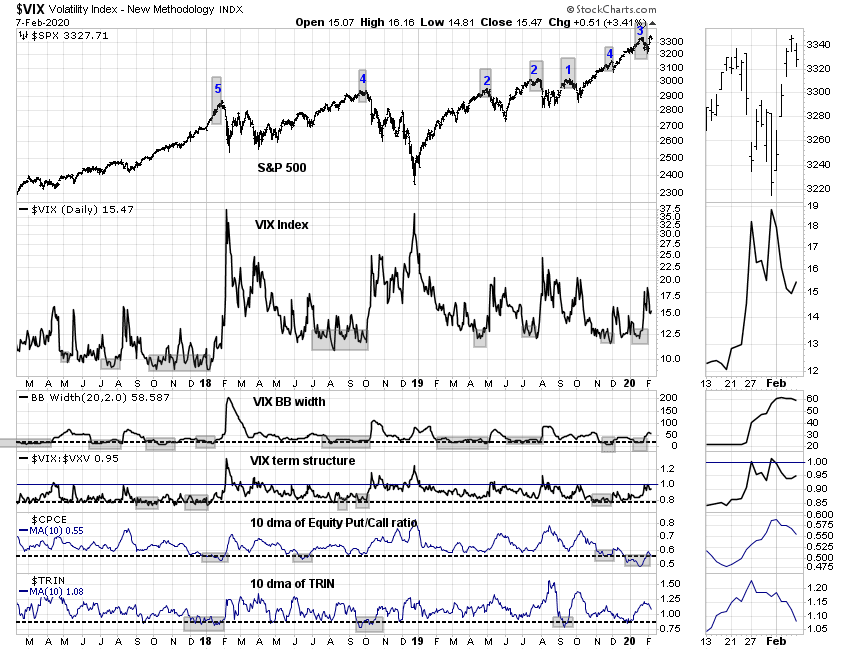
I interpret these conditions as a market that may hit a mild air pocket next week, but not a major decline.
Fragile market internals
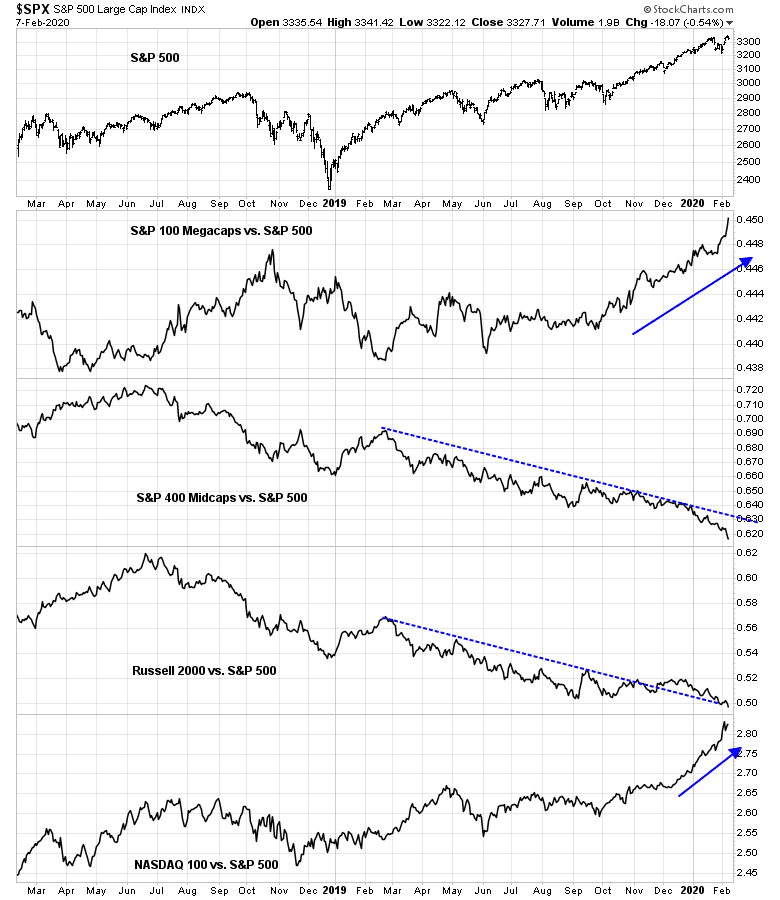
A review of market internals reveals a mixed picture. Market leadership by market cap band shows narrowing leadership by NASDAQ and megacap stops, while mid and small caps lag badly. Conventional technical analysis will conclude that this is not sustainable, and caution is warranted. In the short run, however, NASDAQ and megacaps have gone parabolic. In the words if the legendary technical analyst Bob Farrell, “Parabolic advances usually go further than you think, but they do not correct by going sideways.” The question is how much further does the parabolic move go?
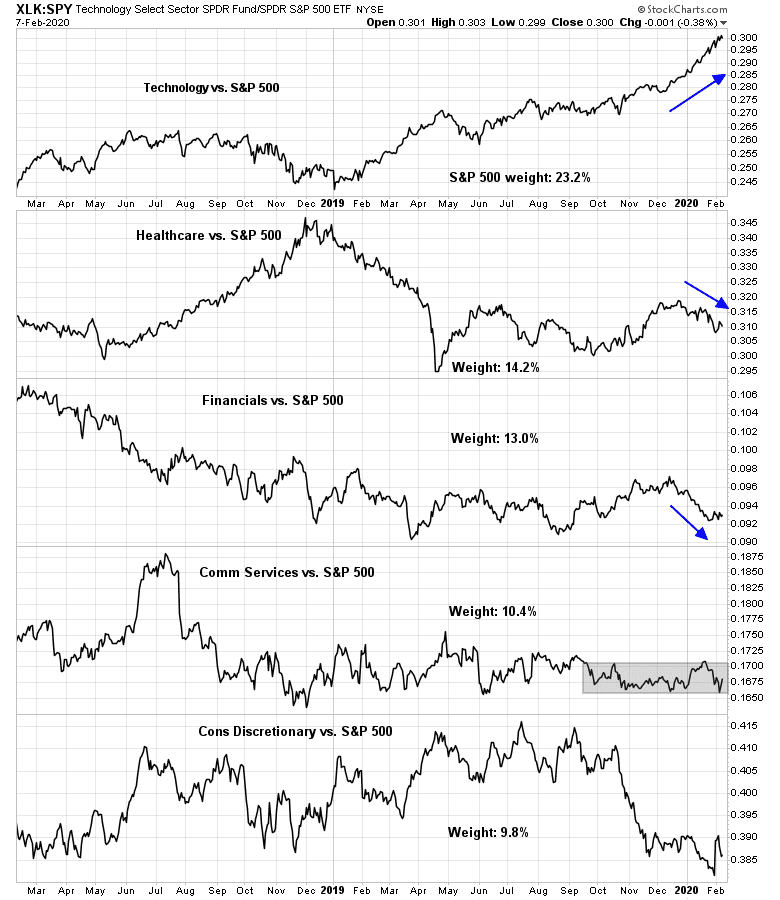
The analysis of the top five sectors tells a similar story. The top five sectors comprise just under 70% of index market cap, and it would difficult to see how the market can make a major move without the participation of a majority of these sectors. The relative performance leader is technology at 23.2% index weight, with healthcare and financial stocks underperforming at a total of 27.2% of index weight. Consumer Discretionary stocks (read: AMZN) at a 9.8% weight staged a brief comeback last week, but relative performance is volatile. This is the picture of narrowing leadership, but also a picture of bulls and bears struggling for control of the tape.
Cross-asset analysis: A muddy picture
Cross-asset, or intermarket, analysis is a similar mixed bag. The bulls can point to the strength in USDJPY, which has historically been highly correlated to the stock market.

The bears can highlight the negative divergence from credit market risk appetite. High yield and EM bonds have underperformed their duration equivalent Treasuries, and the price of these instruments have not confirmed the stock market’s highs.

Cautiously bullish
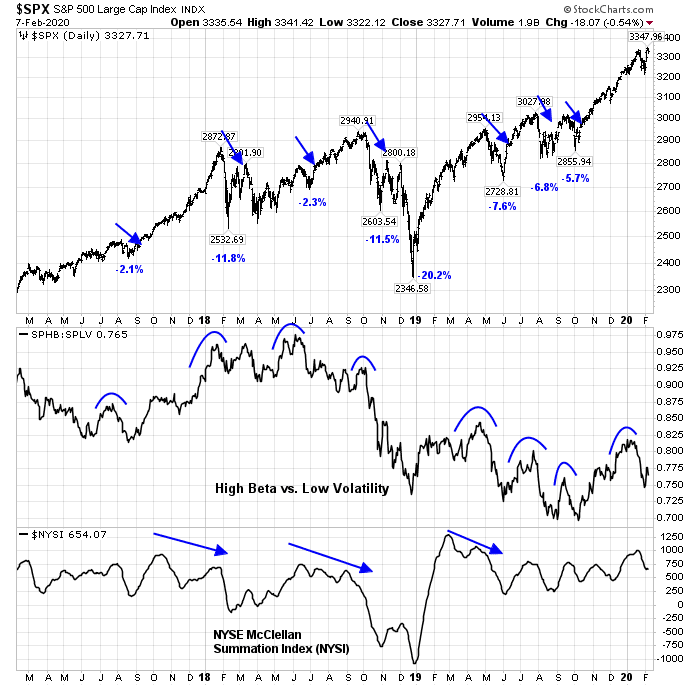
My inner trader interprets these conditions in a cautiously bullish fashion. The ratio of high beta (SPHB) to low volatility (SPLV) stocks (middle panel) has been a useful signal of tradable market tops in the past, and this ratio is not rolling over. My base case scenario calls for a likely pullback to test support in the 3300 area next week, to be followed by a rally to new highs, and accompanied by a negative NYSI divergence and a rollover of the SPHB/SPLV ratio.
Short-term momentum is resetting from an overbought reading.
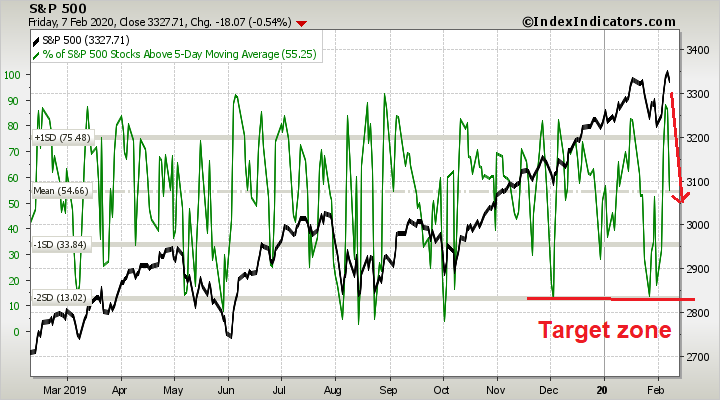
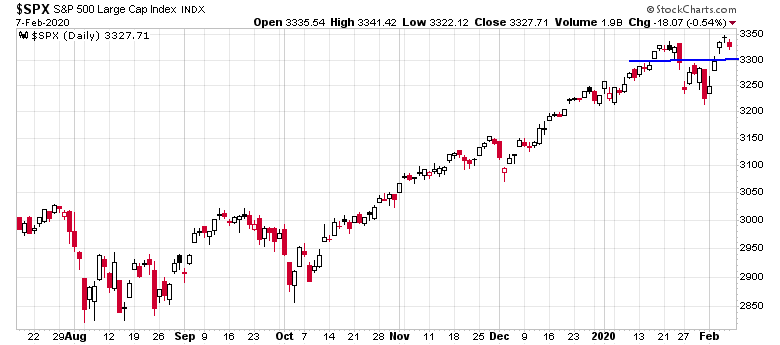
There is a likely support level at about 3300, which I expect to be tested early next week.
Disclosure: Long SPXL
As experienced investor scratch their heads in confusion and wonder at the consistent, unrelenting march higher of the U.S. stock market, there is in my mind one undeniable fact that in 2019, we entered into the CRAZY TIMES for investing. Knowing why is critical in navigating it.
In 2019, the Fed gave up on quelling or reversing the growing mountain of corporate debt. They caved after a brief stock market dip at the end of 2018. Expect them NEVER to meaningfully try again. This will lead to a CRAZY growing mountain of debt that learned
academics and famous investors forecast will end badly sometime. The sometime may be far off.
This also means we have entered CRAZY TIMES for CRAZY LOW INTEREST RATES. The Fed is lowering rates at a time of record low unemployment and trillion dollar deficits with a decent economy. Rates are so low now that they can’t drop them meaningfully if the economy goes into recession. This why the Fed published research on going to negative rates when needed. In other words, CRAZY LOW INTEREST RATES.
So the Fed has both feet on the gas pedal and won’t touch the brake. In fact, I think Paulson has ripped the brake pedal off and threw it out the window. None of the monetary experts, economists, strategists, or anybody knows the end point of these CRAZY TIMES. Before 2019’s surrender by the Fed, I’m sure they expected the Fed to let the air out of the debt bubble slowly. NOT! January 2020 was the biggest corporate debt issuance ever.
Knowing that we entered CRAZY TIMES explains the CRAZY GOOD that happened in 2019. Stocks went up huge when corporate profits fell. CRAZY. Stocks went up when a trade war hurt global trade badly. CRAZY. Stocks had a brief dip when a war almost broke out with Iran with future negative possibilities. CRAZY. Stocks had a brief dip when a possible terrible flu pandemic started. CRAZY.
So CRAZY TIMEs can be CRAZY GOOD or CRAZY BAD.
Here is my list of future CRAZY GOOD things that will have stock markets going up and up as we scratch our heads in confused wonder.
– The Fed keeps dropping rates.
– Trump economic policies get more business friendly.
– Trump takes a polling lead over a left leaning opposition candidate.
– Trump wins the Presidency and starts to fill the Fed with his hand-picked people.
– We head to negative rates with the Fed talking about how good that will be. Stocks will be the only game in town.
At some point, CRAZY BAD will happen. This could be years until the debt bubble pops. The only way I see the stocks markets hit with CRAZY BAD soon would be if we have a geometric melt-up in markets now (15-25% up in three months) that then falls badly under its own weight and severely hurts the current investor optimism and Trump’s stock market re-election pillar. Not likely.
So strap on your seat belt. Expect Crazy Things, likely CRAZY GOOD. We have entered uncharted waters. Future historians will have a field day with this, especially when they have witnesses the CRAZY BAD that happened after the bubble popped.
As Tom McClellan pointed out recently, the Fed repo holdings have actually been declining since peaking on Jan 1st. That the Fed is pumping liquidity into the market via “non QE” may actually be an illusion, even though the balance sheet is expanding and that indirectly benefits the stock market. So tactically I see the market has been getting a bit ahead of itself with the excitement about “non-QE” but mid- to longterm it really seems credible that rates will never go up again and that will at least limit volatility.
I feel like there are two big factors affecting the markets that may be affecting these sharp declines and sharp recoveries.
1. The first is, of course, the possible future expansion off the coronavirus. Epidemiologists seem to have a consensus that the virus will escape China and become a world pandemic. Can the news continue to show that it is contained to China or is it indeed going to start spreading uncontrolled around the world? Some seem to think the virus will slow during the northern hemisphere humid summer months but will return in the fall as the hemisphere gets colder. Is this a true catastrophe or is it going to be controlled much like SARS and MERS?
2. I keep seeing articles that suggest there are not enough stocks for all off the market (i.e. pensions, 401k, etc. stock buyers) to buy. This would mean each time a buying opportunity presents itself these buyers could drive stock prices to unreasonable prices. If we can determine that there is a shortage off equities for such ‘required’ demand is the bull unstoppable no matter what?
These two factors alone could cause extreme market moves that prove difficult to trade.
There are two trends in general favoring the equity market.
1. Incredible compression of the long-end yields.
2. Decline of number of stocks in the market, and the number of shares tradable in circulation.
The first point has resulted in some portion of the 60/40 money into Utilities and REITs. These two sectors are small and now very overvalued. So money still has to go back into equity market.
The second point generally drives share price up over time. A lot of companies learned from AAPL by issuing bonds for share repurchase purpose. APPL does not have to borrow money, but it does because money is cheap. Some companies does not borrow money. They are steady and unexciting companies having good cash flow to repurchase shares and increase dividends. Some examples: TXN, HD, LMT.
The net effects: ever rising share price without excessive PE expansion. So no major blow-up and lower volatility. And more M&A to get the games even more exciting.
One word: cheap money.
A perspective that most don’t consider is that Pension Funds are the major driver of the credit cycle. They’ve grown from 60% of GDP in 1980 to 120% of GDP today. In other words, pension funds represent about $25 trillion dollars. They have to put money to work to earn a 7.5% return, which is the rate of return the actuaries use to determine the level of funding required to meet future pension obligations. While some of that is in equities, they got burnt so badly in the 2001-3 and 2008-9 equity bear markets, that they now invest a disproportionate amount of the new money into fixed income. How in the world do you earn 7.5% in fixed in today’s market? You use 2 to 3x leverage, so that you can buy more bonds for the same dollars invested. That’s what is driving the tsunami of money that is behind the bond market. It’s why corporate treasurers can borrow whatever money they want, no matter how levered they are, no matter their balance sheets. A significant amount of that is going into stock buybacks. No wonder the relentless bull market of the last decade. Brian Reynolds is the bond market guru that persuasively argues that this bull market still has at least 3 years to run, but when it’s over its going to get ugly. He’s basically been saying the same thing now for over 10 years, arguing that the bull market has room to run despite the major corrections we’ve experienced. You can listen to a recorded talk Reynolds gave to RealVision here: https://www.realvision.com/tv/shows/skin-in-the-game/videos/financial-engineering-unfunded-pensions-and-potential-disaster
I don’t know of many defined benefit plans which use significant levels of leverage. It would not be prudent, and the board members of the plans, who are fiduciaries, would be personally on the hook if anything went dramatically wrong.
Can you cite any examples?
This exactly my point. We are living in a CRAZY GOOD investment world now to be followed by CRAZY BAD.
These huge background issues float stocks higher with strangely less volatility, less attachment to valuation rules and shrug off negative news.
I’m mostly going on what Reynolds has said. I believe that @FZucchi has mentioned this on twitter as well. This article also has a section titled: “The Elephant in the Room: Pensions” with regard to the leveraged loan market. https://www.equities.com/news/are-pension-funds-creating-dangerous-risks-by-reaching-for-yield Sorry to not be able to give you more definitive references. You should watch the Reynolds interview on RealVision linked above.