Preface: Explaining our market timing models
We maintain several market timing models, each with differing time horizons. The “Ultimate Market Timing Model” is a long-term market timing model based on the research outlined in our post, Building the ultimate market timing model. This model tends to generate only a handful of signals each decade.
The Trend Model is an asset allocation model which applies trend following principles based on the inputs of global stock and commodity price. This model has a shorter time horizon and tends to turn over about 4-6 times a year. In essence, it seeks to answer the question, “Is the trend in the global economy expansion (bullish) or contraction (bearish)?”
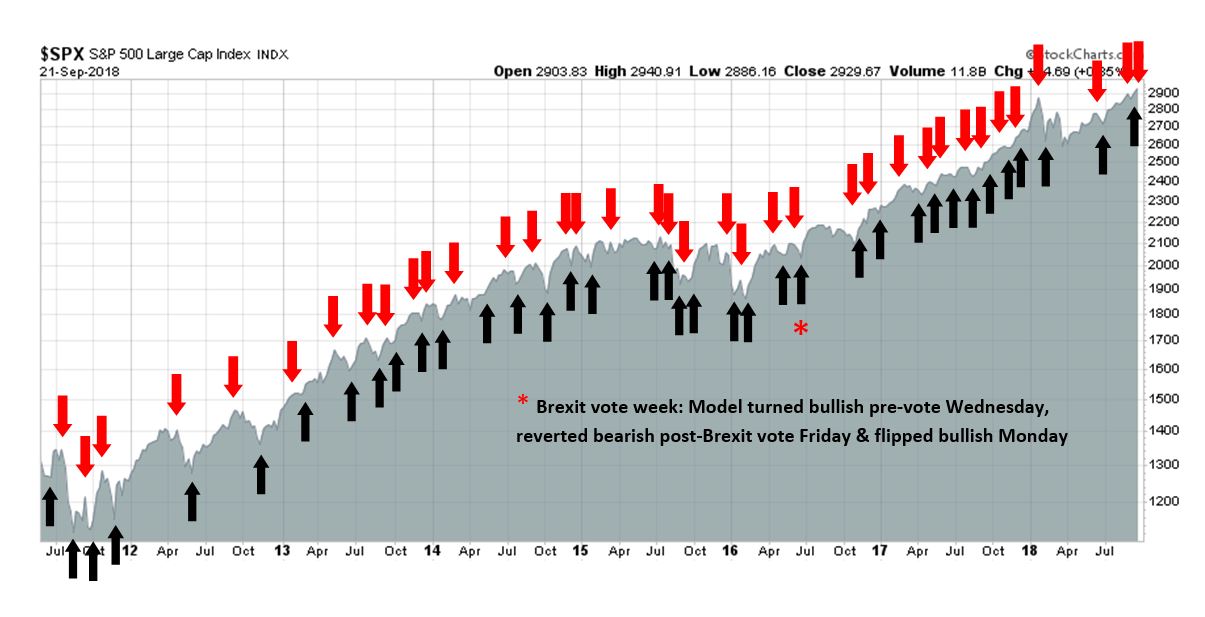
My inner trader uses the trading component of the Trend Model to look for changes in the direction of the main Trend Model signal. A bullish Trend Model signal that gets less bullish is a trading “sell” signal. Conversely, a bearish Trend Model signal that gets less bearish is a trading “buy” signal. The history of actual out-of-sample (not backtested) signals of the trading model are shown by the arrows in the chart below. The turnover rate of the trading model is high, and it has varied between 150% to 200% per month.
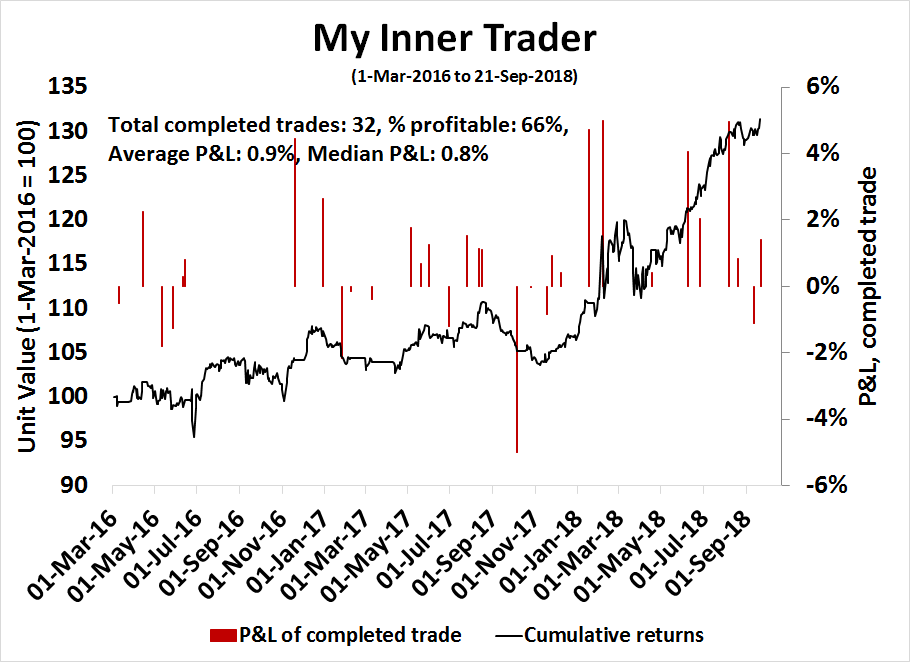
Subscribers receive real-time alerts of model changes, and a hypothetical trading record of the those email alerts are updated weekly here. The hypothetical trading record of the trading model of the real-time alerts that began in March 2016 is shown below.
The latest signals of each model are as follows:
- Ultimate market timing model: Buy equities
- Trend Model signal: Neutral
- Trading model: Bearish
Update schedule: I generally update model readings on my site on weekends and tweet mid-week observations at @humblestudent. Subscribers receive real-time alerts of trading model changes, and a hypothetical trading record of the those email alerts is shown here.
Hawkish surprise ahead?
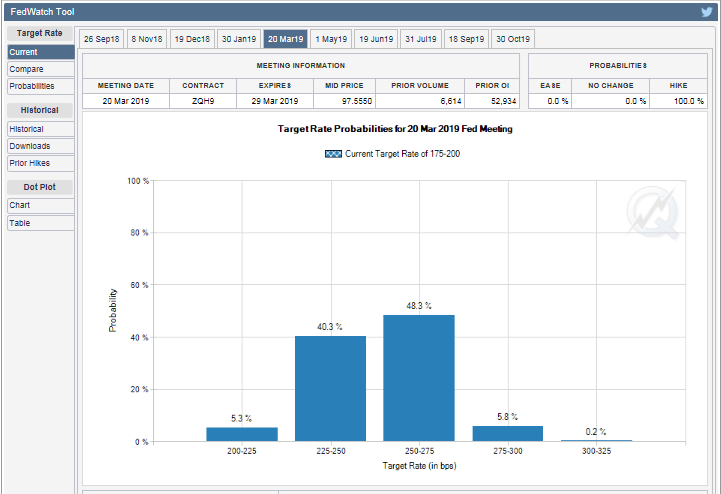
The FOMC is scheduled to meet next week for its September meeting. The market has fully discounted a quarter-point rate hike for the September meeting, and for the upcoming December meeting. Looking ahead to the March 2019 meeting, however, the market isn’t fully convinced the Fed will continue its pace of quarter-point rate hikes every three months.
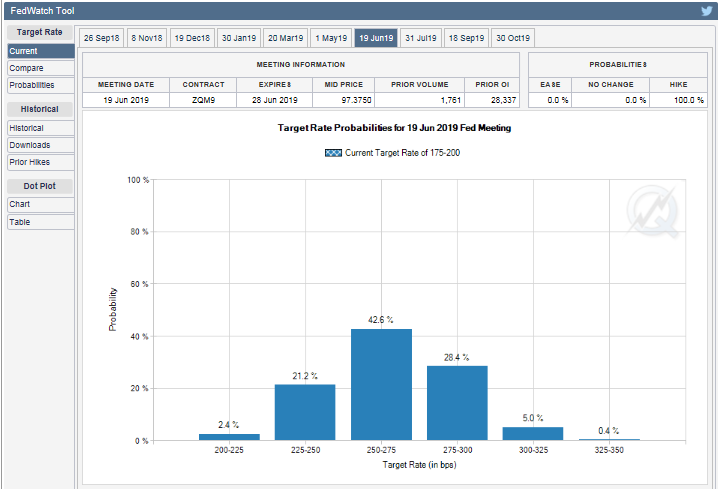
Peering further into the future, the CME’s FedWatch tool for the June 2019 meeting shows that the market has only one rate hike penciled in between December and June.
Will the Fed pause as the Fed Funds rates nears neutral? The market thinks so. But I beg to differ for the following reasons:
- Inflation pressures are rising, which will force the Fed to focus on its price stability mandate.
- The Fed governors, including Fed Chair Jerome Powell, have shown little interest in pausing. Other key Fed officials have indicated that they are not afraid of inverting the yield curve.
In other words, prepare for a hawkish surprise from the September FOMC statement.
Inflation pressures rising
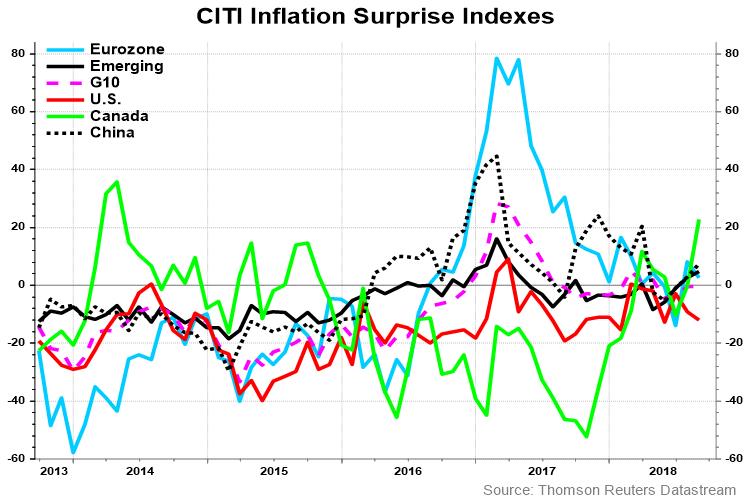
There are numerous signs of rising inflation pressures. Upside inflation surprise is evident everywhere except for the US.
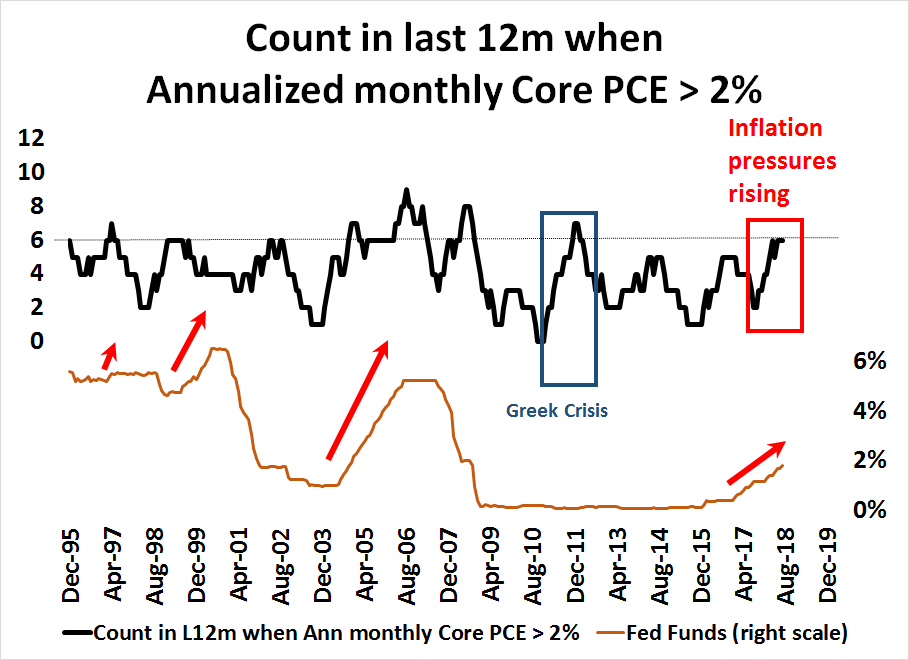
The Fed’s own favorite inflation metric, core PCE, is also showing sufficient inflation pressures for a steady upward march in interest rates. In the past, whenever the trailing 12-month count of annualized monthly core PCE above 2% has exceeded six or more, the Fed has embarked on a monetary tightening program. The only exceptions occurred in 2008, which was the onset of the GFC, and 2011, the Greek Crisis.
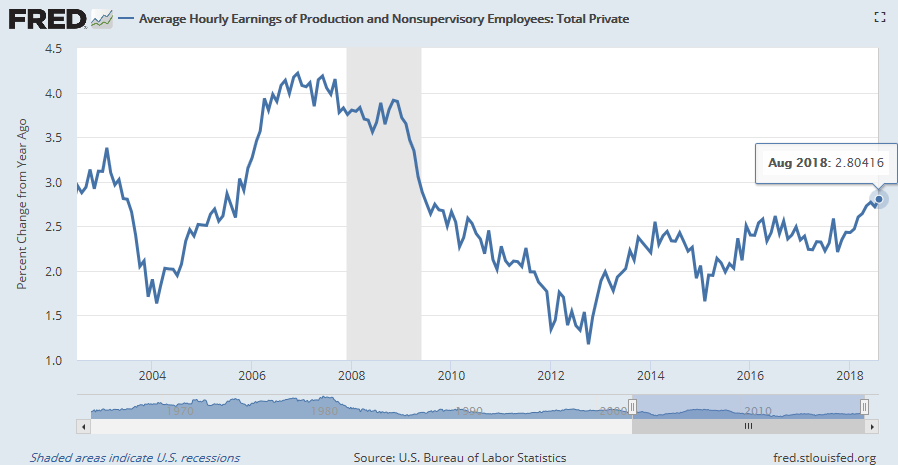
What about wage pressure, which is an input into the Phillips Curve that has been a key tool of the Fed? Average hourly earnings (AHE) has been steadily edging up and now stands at 2.8%.
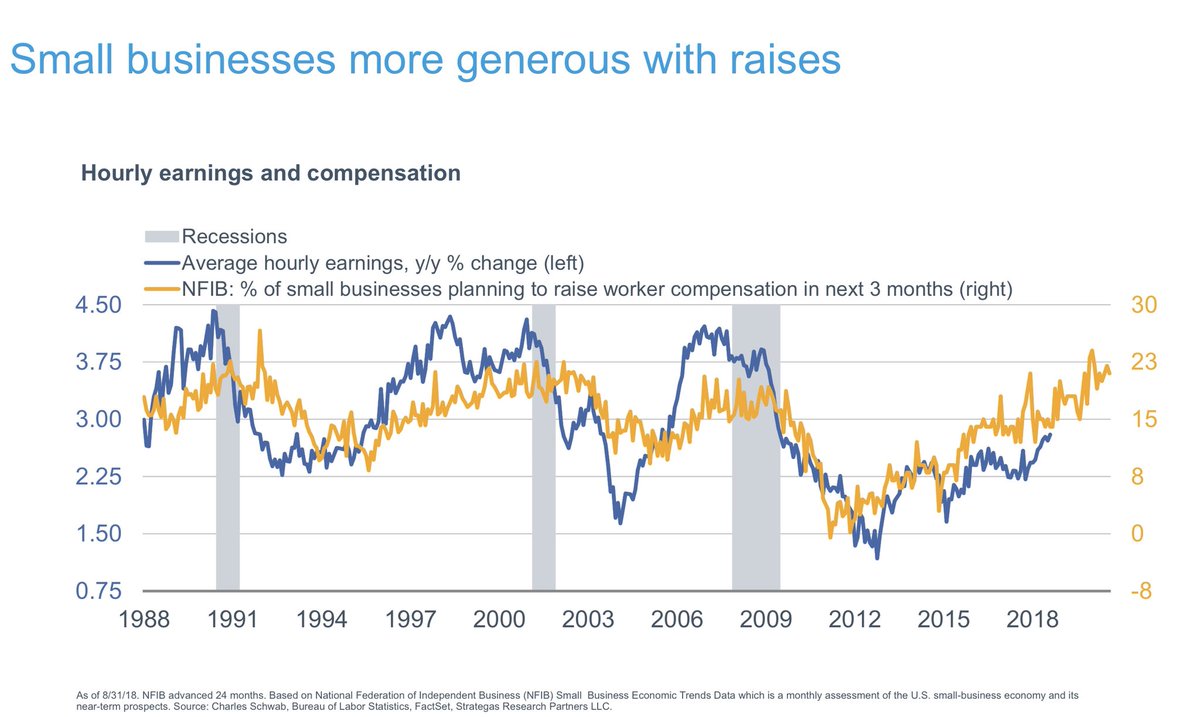
Forward looking wage measures, such as the NFIB survey, shows that AHE continues to face upward pressure.
The Atlanta Fed’s Wage Growth Tracker also reveals another dynamic of wage inflation that is not fully captured by some statistical measures. Job switchers have been able to extract higher wage growth because of the tight labor market.
In addition, the latest Beige Book shows that some employers are using benefits instead of wage increases to cope with the difficulty of recruiting employees. Better benefits may raise compensation costs, but they do not necessarily show up in wage increase metrics [emphasis added].
Labor markets continued to be characterized as tight throughout the country, with most Districts reporting widespread shortages. While construction workers, truck drivers, engineers, and other high-skill workers remained in short supply, a number of Districts also noted shortages of lower-skill workers at restaurants, retailers, and other types of firms. Employment grew modestly or moderately across most of the nation, though Dallas noted robust job growth, while three Districts reported little change that partly reflected a dearth of applicants. Six of the twelve Districts cited instances in which labor shortages were constraining sales or delaying projects. Wage growth was mostly characterized as modest or moderate, though a number of Districts cited steep wage hikes for construction workers. Some Districts indicated that businesses were increasingly using benefits–such as vacation time, flexible schedules, and bonuses–to attract and retain workers, as well as putting more resources into training.
New York
Businesses in most service industries indicated that wage pressures remain fairly widespread, though they have not intensified. A major New York State employer noted success in using non-wage benefits (e.g., vacation, flexible hours) to attract younger workers. Looking ahead, fewer businesses indicated planned wage increases than had been the case in recent months.Chicago
Employment growth picked up to a moderate pace over the reporting period, though contacts expected gains to slow to a modest rate over the next 6 to 12 months. Hiring was focused on production, sales, and professional and technical workers. As they have for some time, contacts indicated that the labor market was tight and that they had difficulty filling positions at all skill levels. Manufacturers continued to report that they had delayed or turned down projects because of difficulties in finding workers. There were also reports of firms forgoing layoffs to avoid the challenge of finding workers when demand picked up. A staffing firm that primarily supplies manufacturers with production workers reported no change in billable hours. Wage growth remained modest overall, with wage increases most likely to be reported for managerial, professional and technical, and production workers. Most firms reported rising benefits costs.Dallas
Wage pressures remained elevated, with more than 60 percent of firms saying they were increasing wages and/or benefits to recruit and retain employees.San Francisco
Wage growth ticked up broadly, and some businesses increased benefits in response to more labor retention challenges. Contacts across the District noted upward compensation pressures for accountants, software engineers, and information technology professionals. In the Mountain West, small businesses moderately raised starting wages and benefit compensation to better compete with larger national employers. In order to retain employees and attract new hires, a few businesses increasingly offered flexible work arrangements.
Pause, what pause?
As the Fed continues with its rate hike program, there has been much discussion about the level of the neutral rate, or R-star. Many market analysts have openly pondered if the Fed would pause as the Fed Funds rate nears the neutral rate.
Forget about it. I reiterate my belief that the Fed appears to be determined to keep raising until it sees the signs of a visible slowdown.
Fed chair Jay Powell stated in so many words in his Jackson Hole speech that the Fed is on course to keep raising until something breaks (see Why the Powell speech was less dovish than the market thinks). As well, the WSJ reported that New York Fed President John Williams is not afraid of inverting the yield curve:
Federal Reserve Bank of New York leader John Williams said Thursday the prospect of a yield-curve inversion by itself wouldn’t be enough to stop him from supporting further rate rises if he thought the economy called for them.
“I think we need to make the right decisions based on our analysis of where the economy is and where it’s heading,” Mr. Williams told reporters after a speech in Buffalo. “If that were to require us to move interest rates up to the point where the yield curve was flat or inverted, that would not be something I find worrisome on its own.”
Fed governor Lael Brainard also stated in an important speech entitled “What Do We Mean by Neutral and What Role Does It Play in Monetary Policy?“. She intimated that the Fed is likely to keep hiking even past neutral by distinguishing between the long-term neutral rate, which is specified in the Summary of Economic Projections (SEP), and the short-term neutral rate, which varies. Fed policy should focus on the short-term neutral rate, which is a function of economic data [emphasis added]:
Focusing first on the “shorter-run” neutral rate, this does not stay fixed, but rather fluctuates along with important changes in economic conditions. For instance, legislation that increases the budget deficit through tax cuts and spending increases can be expected to generate tailwinds to domestic demand and thus to push up the shorter-run neutral interest rate. Heightened risk appetite among investors similarly can be expected to push up the shorter-run neutral rate. Conversely, many of the forces that contributed to the financial crisis–such as fear and uncertainty on the part of businesses and households–can be expected to lower the neutral rate of interest, as can declines in foreign demand for U.S. exports.
In many circumstances, monetary policy can help keep the economy on its sustainable path at full employment by adjusting the policy rate to reflect movements in the shorter-run neutral rate. In this context, the appropriate reference for assessing the stance of monetary policy is the gap between the policy rate and the nominal shorter-run neutral rate.
In conclusion, the question of whether the Fed raises rates at its September meeting is a foregone conclusion. A quarter-point rate hike is baked in. However, investors will be examining the tone of the FOMC statement next to decide whether it was a hawkish or dovish raise.
If you are looking for language in the September FOMC statement hinting that the Fed will pause in the near future, you are likely to be disappointed. In all likelihood, it will be a hawkish raise that will surprise the markets.
Deconstructing the pain trade
What would a hawkish hike mean for investors? What’s the pain trade?
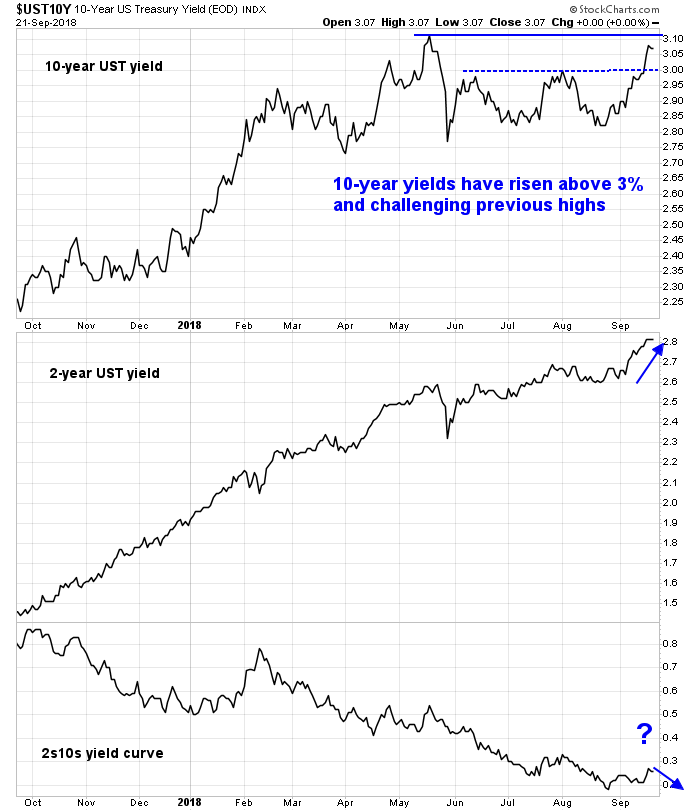
Beyond the obvious equity bearish reaction to a hawkish FOMC statement, the real pain trade might be a flattening yield curve. If the Fed were to signal that it is not finished raising rates, it would certainly put upward pressure on short rates. However, don’t expect a parallel upward shift in the yield curve. While I would not necessarily be so bold as to forecast a bond market rally from falling long rates, 10 and 30 are likely to not rise as quickly as the short end.
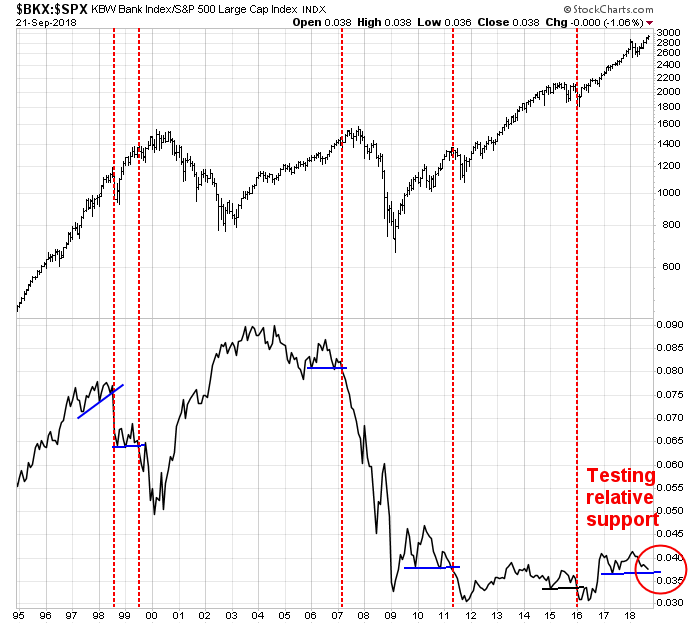
Longer term, I am also monitoring the relative performance of bank stocks. Recall that I pointed out that technical breakdowns in the relative performance of this sector has foreshadowed general equity market weakness (see How to watch for signs of another Lehman Crisis). The relative performance of bank stocks has been highly correlated with the shape of the yield curve, and a flattening yield curve would put downward pressure on the financial sector.
As the chart below shows, the BKX/SPX ratio is on the verge of testing a relative support level as it trended downwards while exhibiting a series of lower lows and lower highs. The yield curve is also displaying a similar flattening behavior.

This will be an indicator to keep an eye on.
In other words, don’t panic, but don’t get overly complacent either.
The week ahead
Looking to the week ahead, there are lots of short-term reasons to turn bearish. Subscribers received an email alert on Friday morning indicating that my trading account had taken profits on its long positions and gone short. There are warnings everywhere:
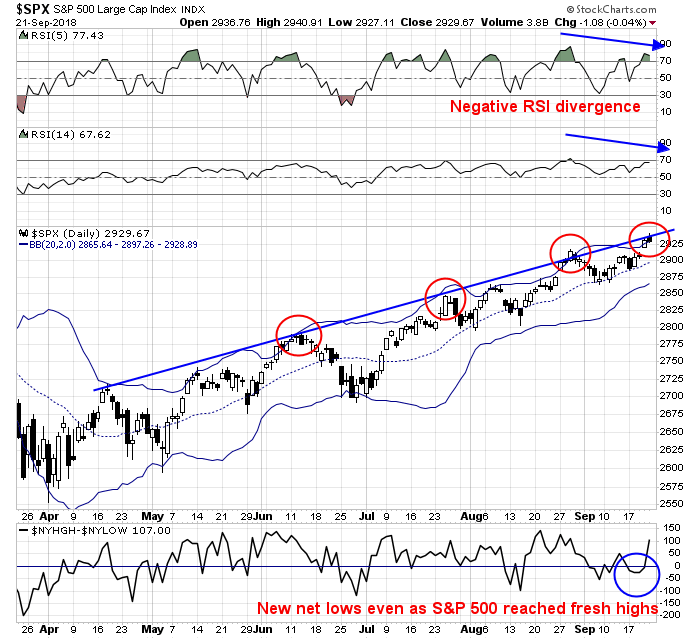
- The SPX had advanced above its upper Bollinger Band (BB) on Thursday and Friday, which is an overbought condition.
- The index was testing its rising trendline Friday before pulling back, which is another overbought warning.
- The market was exhibiting negative RSI divergences even as it rallied to fresh highs.
- The NYSE Advance-Decline Line failed to confirm the market`s all-time highs by registering new highs.
- Even as the market rose last Wednesday and Thursday, there were more new lows than highs on the NYSE.
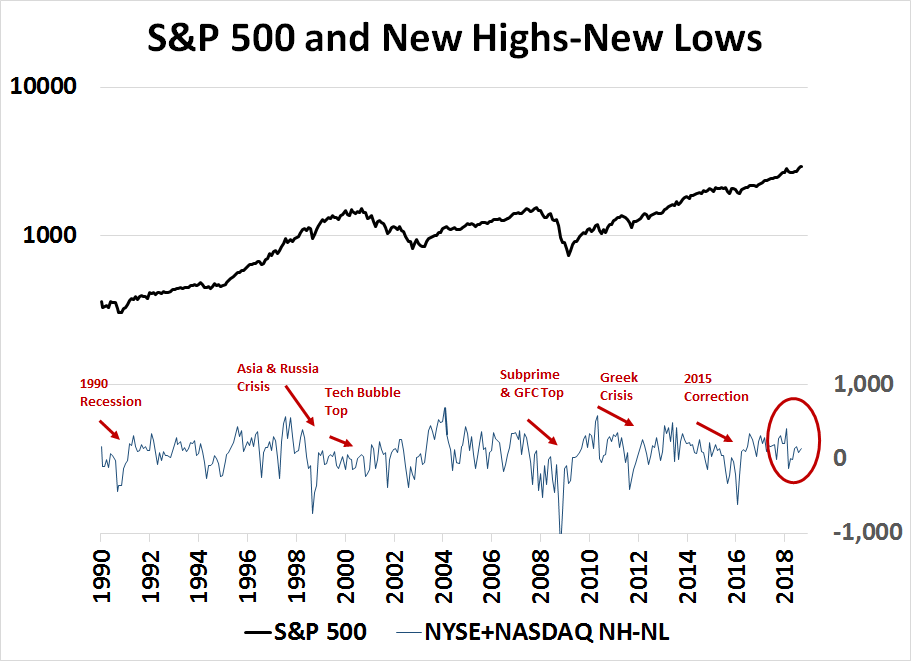
A negative divergence in the net highs-lows breadth indicator has historically been a good warning of a major top. The chart below shows both the NYSE and NASDAQ net highs-lows. The only exception occurred in 2000 at the top of the Tech Bubble, when this indicator failed.

As a solution, I combined the NYSE and NASDAQ net highs-lows into a single metric. As the chart below shows, this combined breadth indicator worked well to warn of pending corrections and bear markets. Currently, the negative divergence in this indicator is another concern for the bulls.
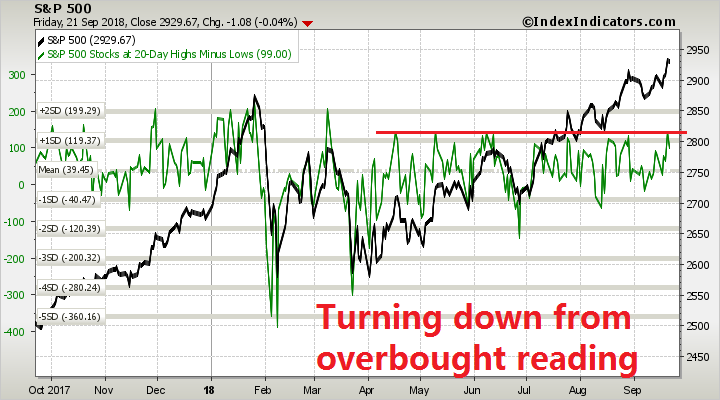
From a short-term trading perspective, medium term (3-5 day) breadth indicators reached an intraday overbought condition last Friday and turned down, which is a bearish signal of waning momentum.
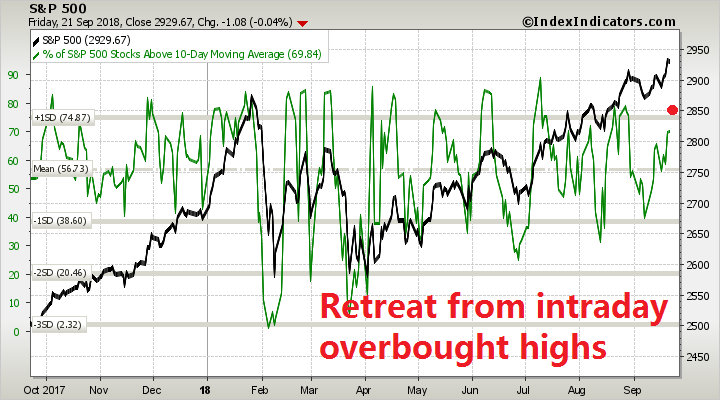
As well, longer term (1-2 week) breadth had reached an overbought condition and weakened, which is another bearish trading signal.
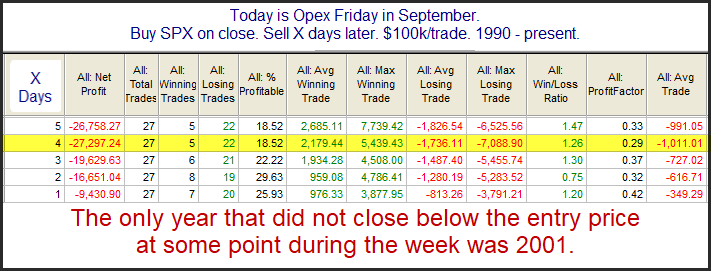
Stock prices are also facing seasonal headwinds. Rob Hanna at Quantifiable Edges found that the week after September option expiry, which is next week, is historically weak. Jeff Hirsch at Almanac Trader also came to a similar conclusion.
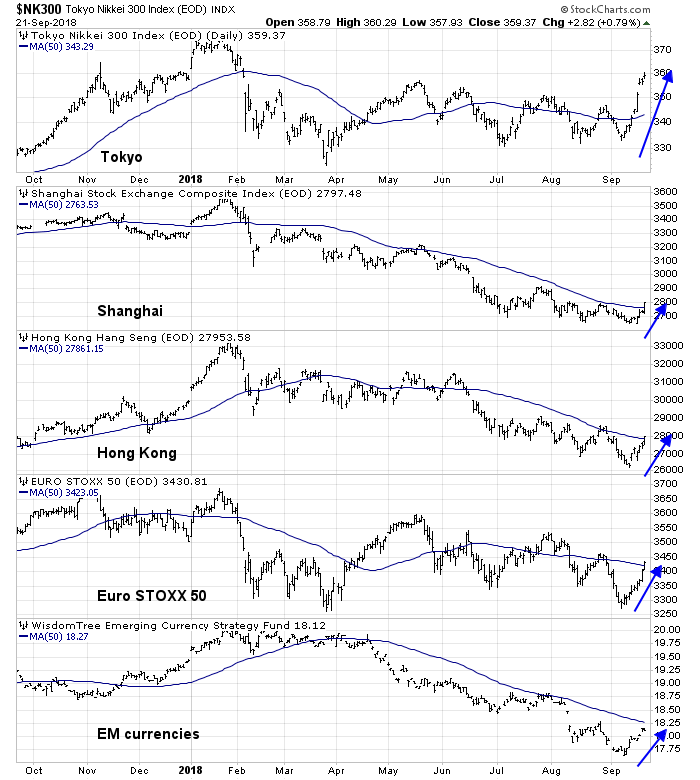
On the other hand, non-US markets are staging a risk-on relief rally. The most impressive was the Japanese market, but the rest of Asia, Europe, and EM currencies also registered gains. This environment should put a floor on stock prices.
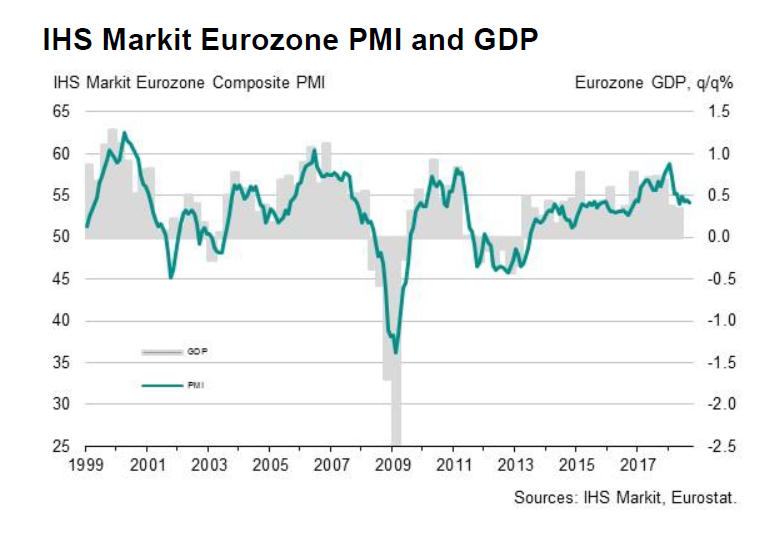
I interpret this market action as only a bounce, as fundamentals remain negative. Starting with Europe, the latest release of eurozone PMI was disappointing, indicating decelerating growth.
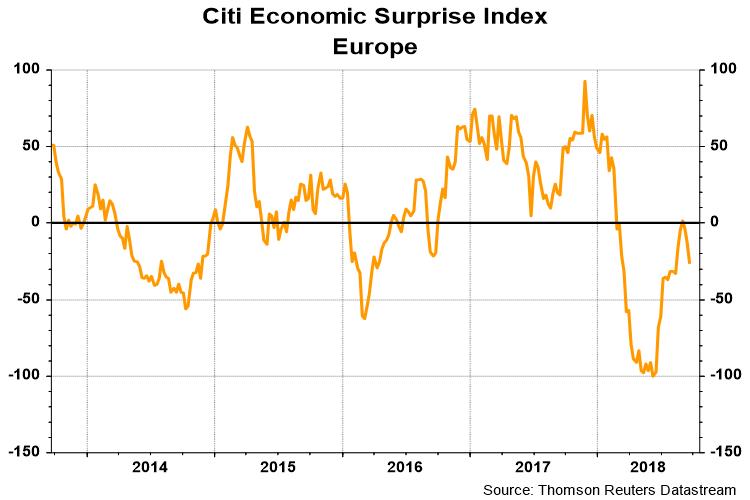
Moreover, the Citi Europe Economic Surprise Index is weakening again, indicating that economic releases are missing expectations.
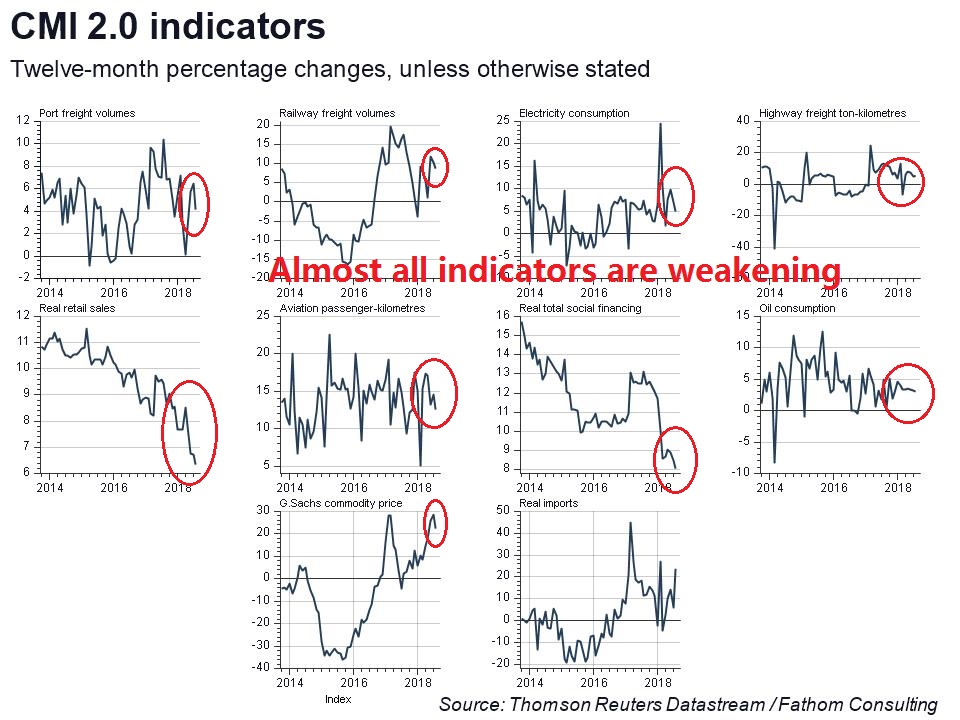
In China, almost all of the economic indicators are weakening with the exception of real imports, which could be explained by an import surge to beat new tariffs.
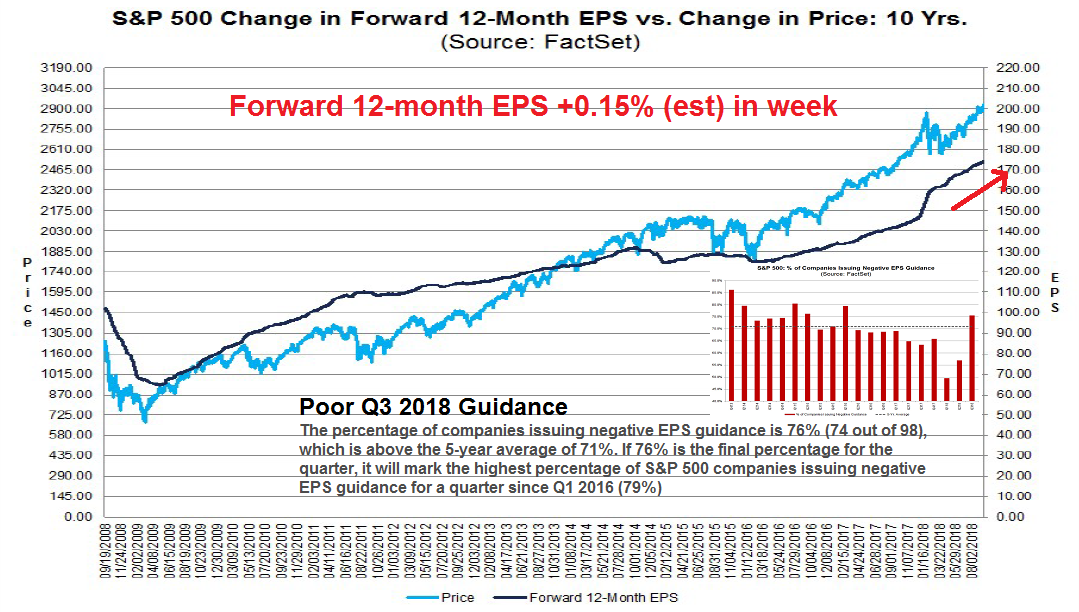
In the US, the latest update from FactSet shows that while forward 12-month EPS continues to rise, Q3 guidance has weakened to below average. This is a message for equity investors to tone down their expectations for Q3 earnings season, which begins in October.
My inner investor continues to be cautious and he has reduced his equity weight. My inner trader took profits in his long positions and reversed to the short side on Friday. The initial downside target can be found using the hourly chart, which shows former resistance turned support at 2915, with a potential gap to be filled in the 2910-2920 zone.

Disclosure: Long SPXU
Fed governors in speeches recently have said that monetary policy should take asset price inflation (stocks, homes, etc) into account, not just the CPI and employment. Powell is not an economist like previous Fed Chairs. If stock prices keep ripping higher don’t expect the the Fed to stop raising rates just because inflation cools. He and others and others at the Fed are looking at the bigger picture of societal excesses that may lead to another crash.