It has been 10 years since the Lehman bankruptcy, which became the trigger for the Great Financial Crisis (GFC). The financial press has been full of retrospective stories of what happened, and discussions from key players.
The GFC was an enormous shock to investor confidence. Ever since that event, many investors have been living with the fear that another tail-risk shock to their portfolios, and they have searched for warning signs that another financial crisis is around the corner.
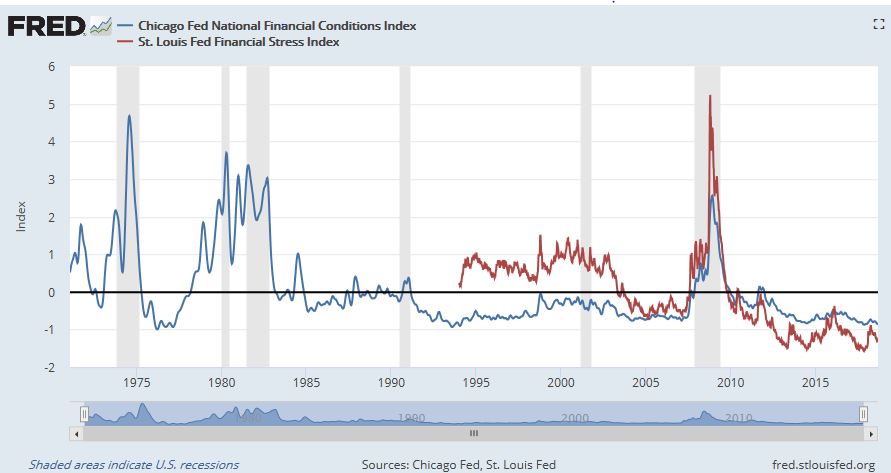
One of the commonly used indicators to measure financial tail-risk are the financial stress risk indicators produced by the Chicago Fed and St. Louis Fed. Right now, readings are relatively benign, as low and negative numbers indicate low levels of financial stress.
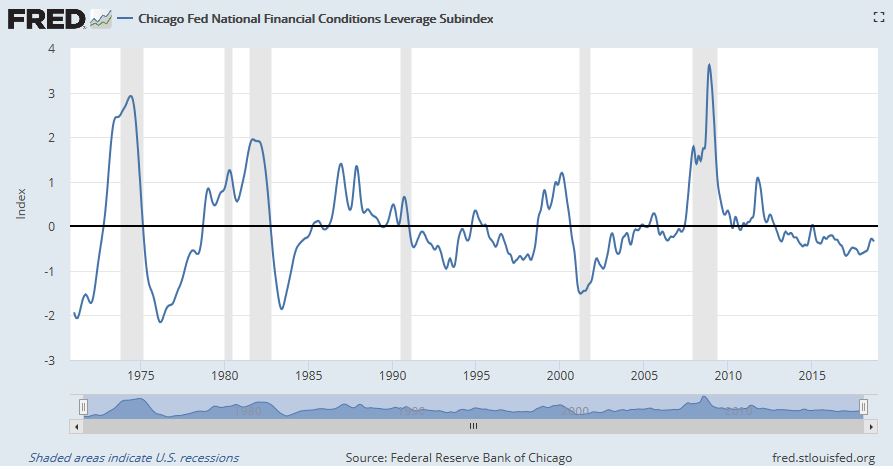
New Deal democrat also monitors the Chicago Fed’s National Financial Conditions Leverage Subindex as a more sensitive indicator of systemic stress. The readings of this indicator are also relatively benign (low = low stress).
For investors and traders who demand real-time results, there may be even a better way.
The Bank Barometer
The chart below depicts the relative performance of the KBW Bank Index (BKX). In the past, technical breakdowns of relative performance have foreshadowed major market tops with the exception of one false positive in late 2015/early 2016.
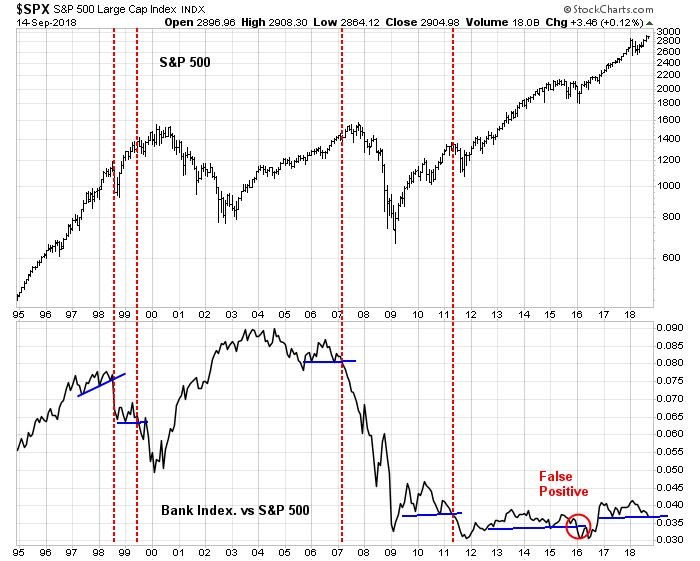
The BKX/SPX ratio provides a real-time warning of rising financial stress, as well as major bear markets. Right now, the ratio is testing a key relative support level, which, if breached, could be the warning of a major equity market top.
The 2-10 yield curve is also an indicator that tracks the BKX/SPX ratio quite closely. The relationship isn’t a perfect fit. For example, the two diverged in late 2017 when financial stocks surged in anticipation of the tax cut bill. Nevertheless, past instances of BKX/SPX technical breakdowns have coincided with yield curve inversions. The false positive breakdown BKX/SPX occurred when the yield curve was still healthy and positively sloping by over 1%.
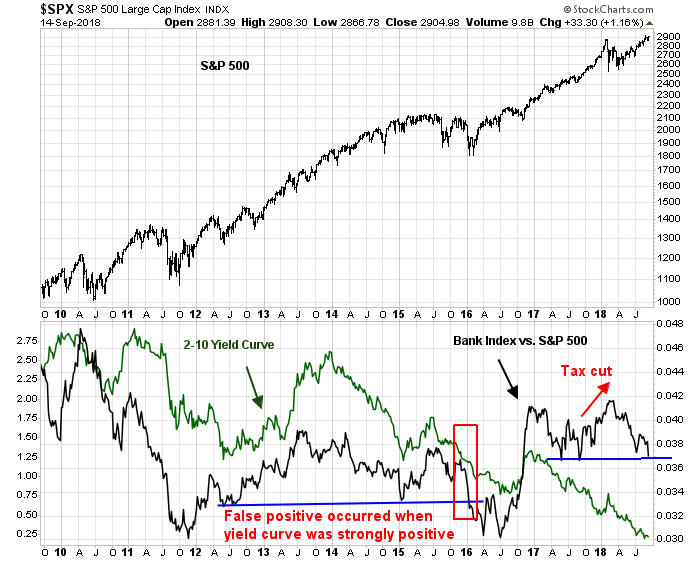
While the yield curve is not currently inverted, it has been steadily flattening for most of this year. Financial and bank stocks have also been underperforming the market in the same period. Should the Fed continue its course of tightening monetary policy, the yield curve is likely to invert by late 2018 or early 2019. The BKX/SPX ratio may suffer a technical breakdown before that.
Are financial risks high today and the red lights flashing? No, definitely not, but this indicator is starting to flicker red.
Stay tuned!
How to watch for financial crissis?
Need graph.
X axis = Time, say in months
Y axis = House Purchase Price / Income
I’ve nedd seen a graph like this but it would seem to me that if things are out of control then this ratio would start heading up over time.
Junk bond spreads are also a key sign. They too are benign now but emerging markets bond spreads are blowing out. Maybe the next crisis will be from outside the US and blindside American centric investors.
Ken
Amongst all the great links, you have sent earlier, can you send a link to EM bond spreads?
Ken
Amongst all the great links, you have sent earlier, can you send a link to EM bond spreads? Thanks.
Try this:
https://fred.stlouisfed.org/series/BAMLEMCBPIOAS
Thanks for the indicator watchlist and thanks to all the great commenters as well.