Mid-week market update: Since early May, it has been evident that the bulls have regained control of the tape (see The bulls are back in town). Not much can faze this market. Even today’s hawkish Fed rate hike left the market down only -0.4% on the day. The question for investors then becomes how far this rally can go.
From a technical perspective, the answer was surprising. Applying point and figure chart on the SPX yielded a target of 2609 using the parameters of daily prices, and the traditional box size and 3 box reversal. Extending the time horizon to weekly prices, the target was 2549, and monthly prices, 2579.
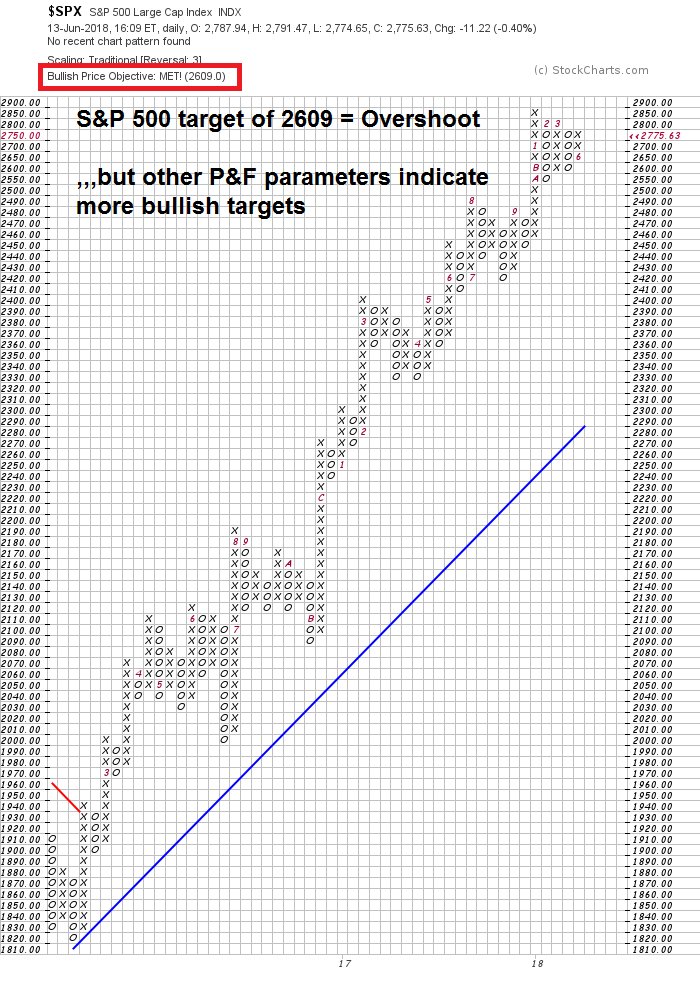
This analysis implies that the market has overshot its target. But varying the parameters using a % box size told a different, and more bullish, story.
A point and figure chart using daily prices with a 1% box size and 3 box reversal yielded a target of 3185. The target was the same (3185) using weekly prices, and an astounding 4617 using monthly prices.
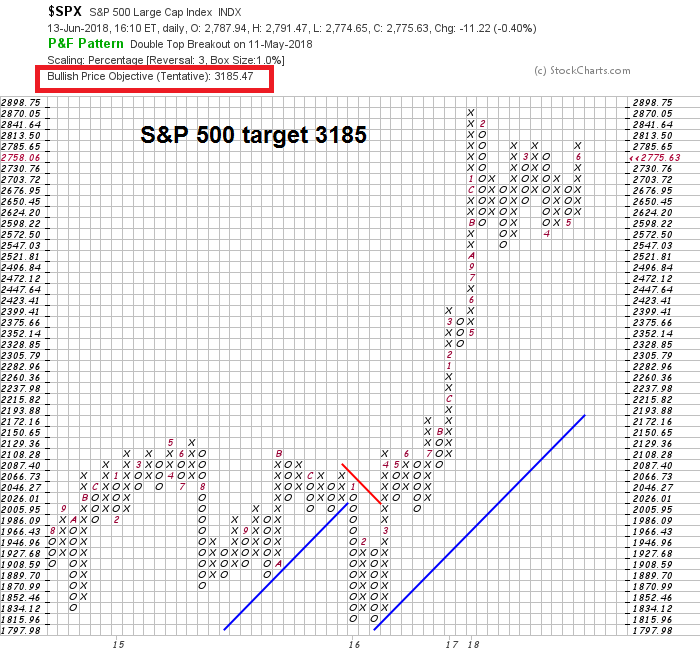
What if we used a 0.5% box size? The target using daily prices was 3012, which is similar to the 1% box chart, The weekly chart had a target of 3008, and the monthly chart had a target of 2569(!)
What does this all mean? If we assume that the market has not topped out, a price target of 3000-3100 for this market cycle may be a realistic assumption. On the other hand, the huge variation in point and figure targets is also an indication that the risks to this market is rising.
Market still overbought
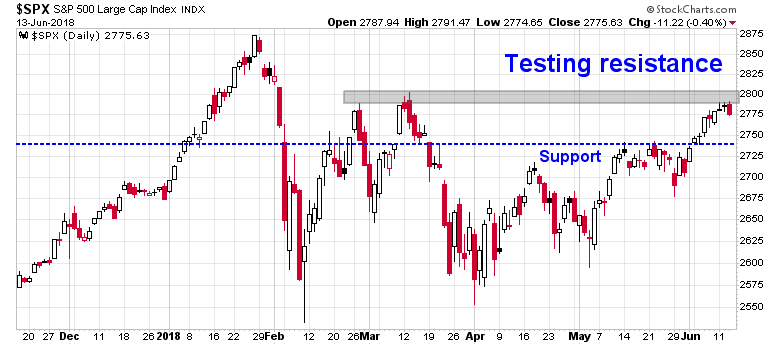
In the meantime, the market is still overbought short-term and vulnerable to a correction. The SPX is hitting a resistance band at these levels, and overbought conditions suggest that a brief pullback or consolidation is ahead.
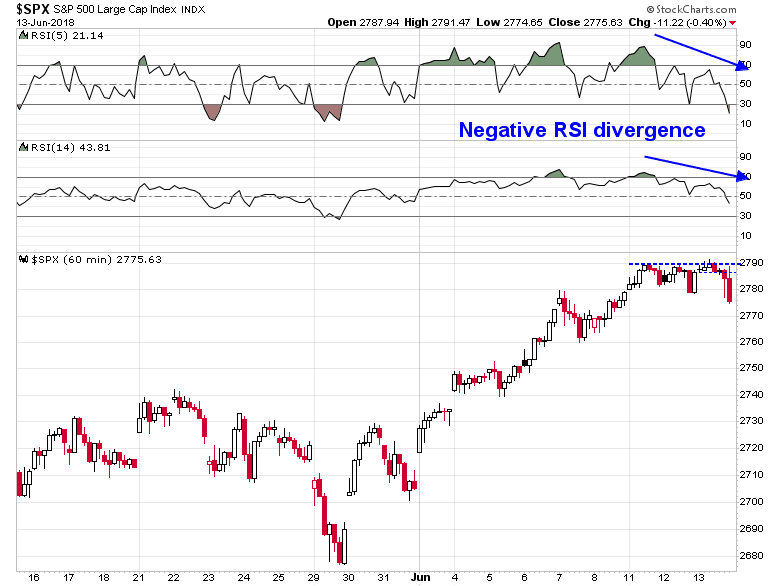
The hourly chart reveals the risks. The market is exhibiting a negative divergence even as it tested overhead resistance.
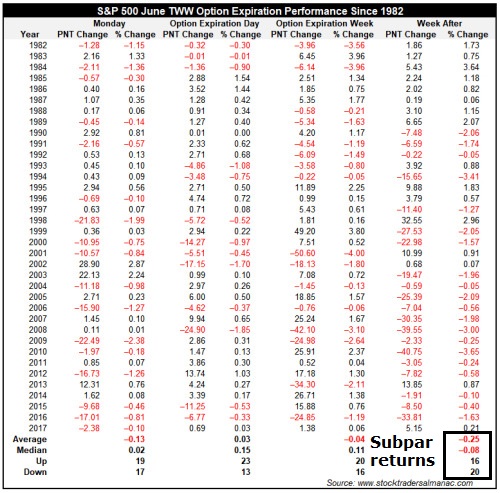
I would also point out that this week is OpEx week, and Jeff Hirsch at Alamanac Trader observed that the week after June OpEx has been challenging for equity bulls.
My inner trader initiated a modest short position last week, with the first downside target at 2740 and further target at 2700. He is prepared to turn bullish if the index stages a decisive breakout above 2800.
Disclosure: Long SPXU
RecessionAlert is calling for a global eco slowdown. This is coming as QT continues to push bond yields higher and USD higher as well (to the extent tariffs and deficits don’t push the other way for the latter). This seems like a recipe for cash to remain a safe haven and continuing unwind in commodities, EM assets and continued outperformance of SPX vs EAFE as well as tech/growth over cyclicals/value. Thoughts?