Mid-week market update: Charles Dow once characterized the stock market`s price movement as being composed of tides, waves, and ripples. We can see a mini version of this thesis by the market’s action in the past week. The major indices had staged an upside breakout through a downtrend and sentiment had turned bullish.

This week, the narrative became more cautious:
- 10-year bond yields had spiked significantly above 3%.
- The US-North Korea summit is at risk of going off the rails.
- The anti-migrant Lega Nord and anti-establishment Five Star Movement are on the verge of forming the next Italian government.
- The Sino-American trade talks are undergoing their own roller coaster. Trump’s weekend “rescue ZTE” tweet was followed by a White House clarification that walked back some of rhetoric.

Which is the wave? Which is the ripple?
Intermediate term trend is up
From a technical perspective, the intermediate term trend remains constructive. Breadth, as measured by the NYSE Common Stock only McClellan Summation Index, has broken out to the upside, and stochastics are not overbought.

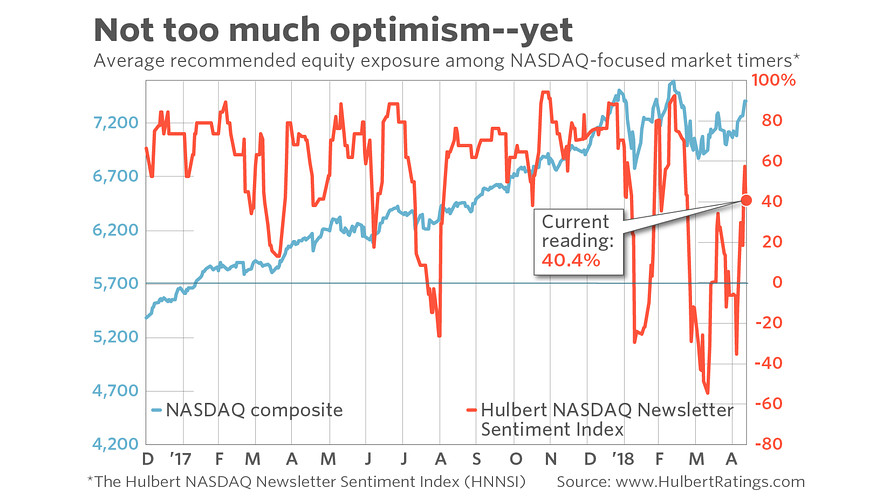
Another constructive data point comes from Mark Hulbert. Hulbert’s sample of NASDAQ market timers have turned bullish, indicating positive momentum, but readings are neutral and not extreme yet.
Risk appetite, as defined by HY relative price action, and price momentum, remain in uptrends.

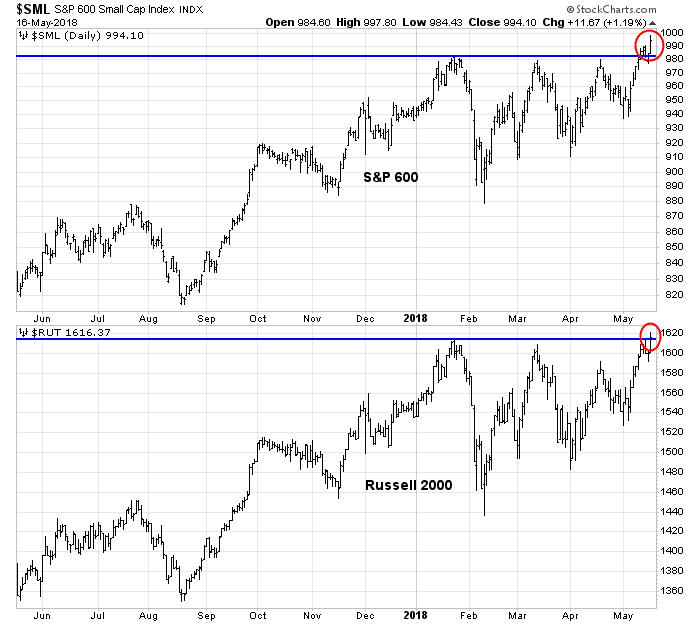
The high beta small caps are breaking out to the upside. The S&P 600 had already broken out to all-time highs, and the Russell 2000 just made a new high today.
Watch the ripples
I had suggested that there was support for the SPX at about the 2700. An open gap was partially filled, and the area is also the site of the downtrend line which the market could test on a pullback.
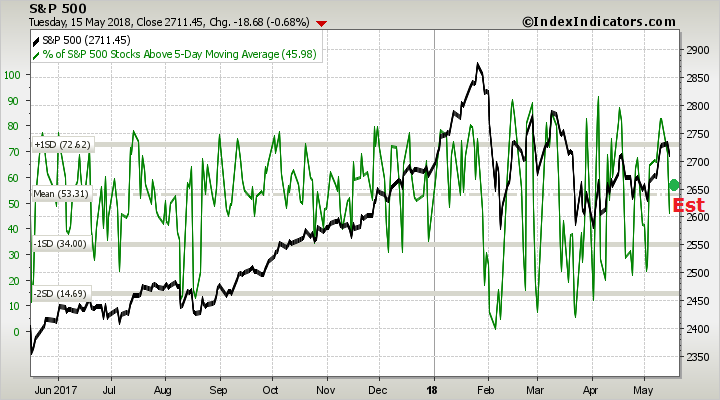
Short-term breadth (1-2 day time horizon) from Index Indicators is sloping downwards and have not reached oversold levels, which suggest that the pullback may not be over.
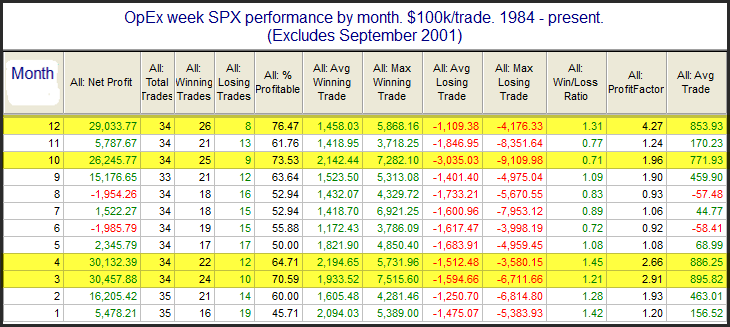
This week is OpEx week, and Rob Hanna’s study found that the historical pattern for May OpEx had no edge, with 17 up weeks and 17 down weeks.
I interpret the current market action as the stock prices undergoing a minor pullback in an intermediate uptrend. Short-term indicators are not oversold, and history suggest further choppiness. The path of least resistance is up, but the correction has probably not fully run its course.
My inner trader is long the market and he is buying the dips.
Disclosure: Long SPXL
Hi Cam, Do you mind commenting on lumber prices – why are they doing so well. I have lumber stocks like Canfor and Norbord showing in my work and would be interested in any insight you could share on lumber . Thanks AJD