Preface: Explaining our market timing models
We maintain several market timing models, each with differing time horizons. The “Ultimate Market Timing Model” is a long-term market timing model based on the research outlined in our post, Building the ultimate market timing model. This model tends to generate only a handful of signals each decade.
The Trend Model is an asset allocation model which applies trend following principles based on the inputs of global stock and commodity price. This model has a shorter time horizon and tends to turn over about 4-6 times a year. In essence, it seeks to answer the question, “Is the trend in the global economy expansion (bullish) or contraction (bearish)?”
My inner trader uses the trading component of the Trend Model to look for changes in the direction of the main Trend Model signal. A bullish Trend Model signal that gets less bullish is a trading “sell” signal. Conversely, a bearish Trend Model signal that gets less bearish is a trading “buy” signal. The history of actual out-of-sample (not backtested) signals of the trading model are shown by the arrows in the chart below. Past trading of the trading model has shown turnover rates of about 200% per month.
The latest signals of each model are as follows:
- Ultimate market timing model: Buy equities
- Trend Model signal: Bullish
- Trading model: Bearish
Update schedule: I generally update model readings on my site on weekends and tweet mid-week observations at @humblestudent. Subscribers will also receive email notices of any changes in my trading portfolio.
Tax reform jitters
This was the week that jitters over the Republican tax bill finally caught up with stock prices. Now that both the House Republicans and Senate Republicans have different versions of a tax bill, the market is waking up to the challenges ahead.
- Both Houses of Congress have to reconcile their bills, which may not be easy. Further bargaining lies ahead, which has the potential to dilute the bullish effects of any corporate tax cuts.
- Any bill will have to overcome the twin Byrd Rule hurdle of $1.5 trillion in incremental deficit in the next 10 years, and no further deficits after 10 years. Any violation of the Byrd Rule would require 60 votes in the Senate, which would be challenging as the GOP only has a 52-48 seat majority.
- The Roy Moore scandal is creating additional uncertainty, as a Moore loss in the December special election in could cut the Republican majority to a single vote in the Senate.
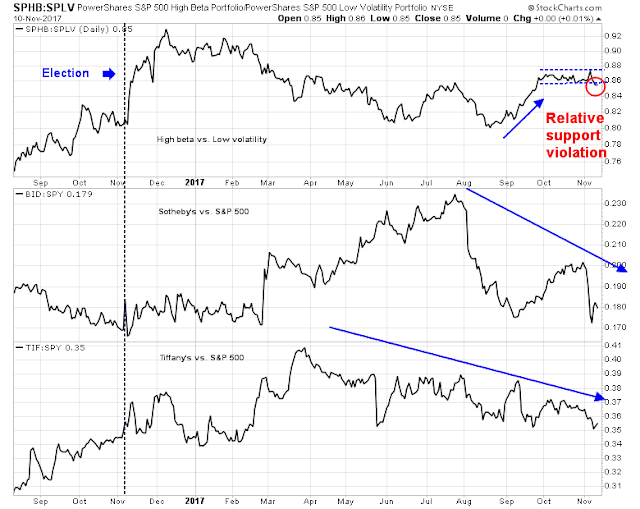
Even before stock prices got spooked, the market showed signs it was ready to go down. There were cautionary signals from risk appetite indicators, which signaled rising skepticism over the passage of any tax bill. The top panel depicts the relative performance of high beta vs. low volatility stocks as a metric of risk appetite. Risk appetite perked up in September as the odds of a tax cut became more likely, then flattened out into a range. This pair broke down through a relative support on Friday. The other pairs show the relative performance of “champagne” stocks Sotheby’s (BID) and Tiffany’s (TIF) against the market. The “champagne” stocks have been underperforming the market for the last few months, which is another sign of market skepticism that much was going to be accomplished on the tax bill.
As well, the latest update from John Butters of FactSet shows that the market reaction to earnings reports may be showing signs of bullish exhaustion. EPS beats were barely being rewarded, while misses were severely punished (annotations are mine).
Tax cut headwinds
Bloomberg published a good summary of the challenges that the GOP faces in reconciling the House and Senate versions of the tax bill. Both chambers have boxed themselves by generating $1.5 trillion in deficits over 10 years, but different tax breaks and revenues sources in both bills. The reconciliation process will have to make the difficult choice of deciding which provision to keep (and add) in order to add up to a final $1.5 trillion deficit.
Jonathan Traub, who oversees tax policy for Deloitte Tax LLP, said the biggest sticking points will emerge as the Senate Finance panel begins rehabbing its bill to comply with Senate rules.
“That’s a hole that Hatch and the other Senate Republicans are going to have to fill,” Traub said. “And how they fill it may not be very attractive to House Republicans. It’s an unenviable challenge they face.”
On the House side, last-minute changes to the bill before it cleared the Ways and Means Committee on Thursday pulled its price tag under the $1.5 trillion allowed in the first decade under the budget resolution.
“Today, the first and oldest Committee in Congress passed transformational tax reform legislation that charts a new course for the country,” Ways and Means Chairman Kevin Brady said after his panel approved his tax bill.
To get there, the panel appears to have employed a touch of fiscal finesse: The single biggest source of new revenue in Brady’s changes stems from a revision that wouldn’t take effect until 2023 — raising questions about whether Republicans in Congress would ever really let it happen.
Then they have to appease the deficit hawks in the Senate as they navigate their fragile two seat majority:
Three senators have already raised concerns about tax cuts that increase the deficit, including Senator Bob Corker of Tennessee, Senator James Lankford of Oklahoma and Senator Jeff Flake of Arizona. “I remain concerned over how the current tax reform proposals will grow the already staggering national debt,” Flake said Thursday, calling for a “fiscally responsible” bill.
The Republicans may also be driven by an increasing sense of panic. Cristina Marcos of The Hill reported that one House Republican admitted that donations are likely to dry up should the tax reform bill fail. Falling political contributions would reduce their chances of retaining control in the midterm elections next year.
Moreover, the special Senate election in Alabama on December 12 to choose Jeff Session’s successor may represent a key deadline. Republican candidate Roy Moore has been accused of sexual improprieties with minors, and the news has split the Party. While there has been an outpouring of support for Moore, Politico reported that the National Republican Senatorial Committee has withdrawn its financial support for Moore’s campaign. Three GOP senators, Bill Cassidy of Louisiana, Steve Daines of Montana, and Mike Lee of Utah, have rescinded their endorsement of Moore. More importantly, Donald Trump put out a press statement distancing himself from Moore:
Like most Americans, the President believes that we cannot allow a mere allegation — in this case, one from many years ago — to destroy a person’s life. However, the President also believes that if these allegations are true, Judge Moore will do the right thing and step aside.
As the news of the scandal broke, the latest poll showed that his Democrat opponent Doug Jones had pulled even with Moore in support, which is highly unusual in a state that has leaned deeply red like Alabama. Should Moore lose the special election, it would erode the Republican majority in the Senate to a single vote, even as the leadership tries to manage the opposition of maverick senators such as Corker, Flake, Lankford, McCain, and Collins.
Warnings from technical deterioration
Even before last week’s market weakness, the stock market’s technical internals were looking rather unhealthy, as market breadth has shown signs of deterioration even as the index rose.
It could be said that market breadth is an imperfect timing tool. Negative divergence can exist for months before the major averages drop. The credit markets is another matter. Jeff Gundlach issued a series of warnings based on the action of the junk bond market.
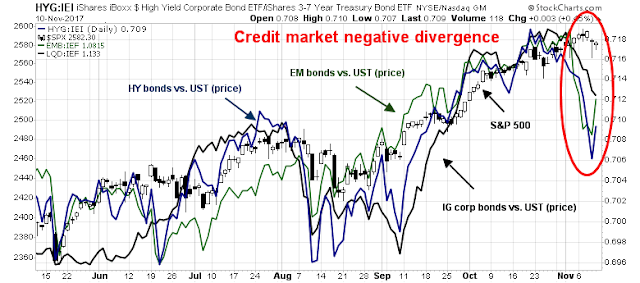
While Gundlach highlighted the negative price action of junk bond, or high yield (HY), ETFs, I prefer to focus on the relative price action of HY bonds to equivalent duration Treasury paper, which neutralizes the interest rate effect to analyzes the credit spread effect (see The market`s report card on the GOP tax bill).. As the chart below shows, credit spreads were not only rising in the HY market, but investment grade corporates and EM bonds too. Even though HY and EM bonds recovered a bit on Friday, IG relative performance continued to deteriorate, indicating that further stress is likely ahead.
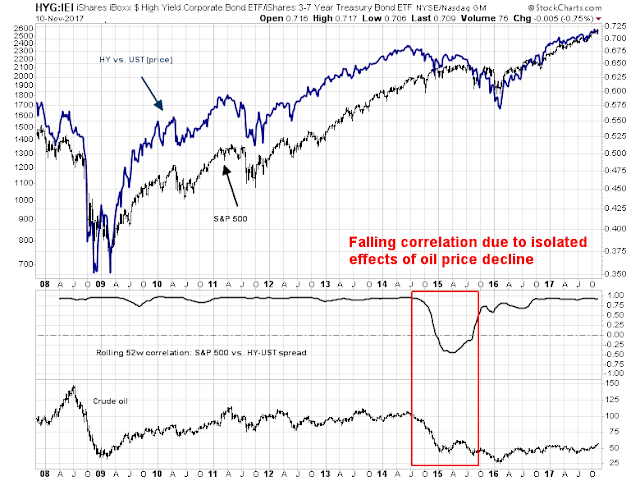
Indeed, the approach of using HY to measure risk appetite can be useful as a confirmation signal. The chart below shows the history of equities and the relative performance of HY to UST. With the exception of a brief episode in late 2014 when energy related HY dragged down the performance of the sector, the two series have been highly correlated in the last 10 years.
Don’t panic, it’s only a correction
Even if the tax bill were to fall apart and stock prices sell off, I would be inclined to buy the dip, as the intermediate term outlook is still bright. Fundamental momentum remains positive, which is bullish. FactSet reports that, with Earnings Season nearly over, EPS and sales beat rates are well above historical averages, and forward EPS is rising robustly, indicating Street optimism about the earnings outlook for 2018, even without tax cuts.
From a top-down perspective, the nowcast of the economy is upbeat. Initial jobless claims has shown a remarkable inverse relationship with stock prices in this expansion, and claims continue to fall.
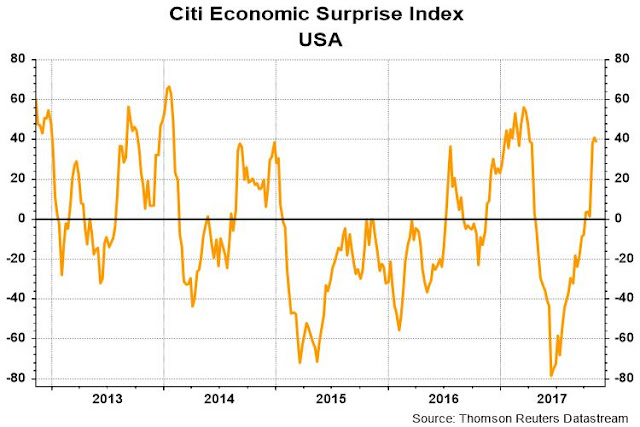
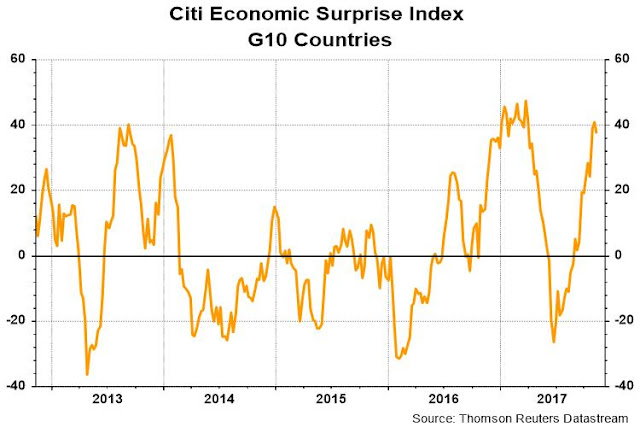
The Citigroup Economic Surprise Index is rising, indicating that high frequency economic releases are handily beating expectations.
The upturn is global, and not just isolated to the US.
My inner investor would therefore regard any significant weakness in stock prices as a buying opportunity.
Correction not over
If we were to assume this is the start of a long awaited correction, then most indications suggest that it is not over. Short term indicators have not reached oversold and fear levels consistent with bottoms. After the SPX breached its uptrend line late last week, I am now watching both the RSI-14 to see if it can reach a minimum target of 50, and the VIX Index to see if it can breach the upper Bollinger Band (BB), which would flash an oversold condition.
Short term breadth indicators from Index Indicators are nowhere near an oversold reading.
Intermediate term indicators like the NYSE Common Stock McClellan Summation Index is also not oversold.
The Fear and Greed Index stands at 54, and the market has historically not bottomed until it has fallen to 40 or less.
My inner investor remains neutrally positioned, with his stock and bond weights at roughly their investment policy weights. My inner trader is short the market, and waiting for oversold conditions to materialize before he covers his position.
Disclosure: Long SPXU





The rate spread on junk debt is starting to widen quickly. If it blows out, the market is vulnerable to a significant correction.
There are sections of the tax legislation that restrict the interest write-off on corporate debt. Does anyone have a thought on this. If weak companies can’t borrow because of these changes, maybe their existing junk debt falls in price. I suspect many companies have been kept alive by willing investors buying their junk bonds.
At this point, no one know how the tax legislation is going to play out, or if there will be tax legislation passed. If not, expect a risk-off response.
JNK and HYG tends to lead spx cash by a few days to a few week, esp this year on the highs. its not just correlation. Cam, maybe you can do a stat on that. thx.
Monday, 10 AM EST. Cam, You wrote “I am now watching both the RSI-14 to see if it can reach a minimum target of 50, and the VIX Index to see if it can breach the upper Bollinger Band (BB), which would flash an oversold condition.” I was shocked to see those words partly because with the much ballyhooed lack of volatility, the VIX already this morning breached the upper … Also, an RSI target of 50; what happened to the usual 30, or less? I have been saying for months that Cam has, for the most part, been on the wrong side of the market since September. While everyone has a poor performance patch once in a while, and you must be feeling pressure from your “trading” account calls these past three months, please do not lower the bar so you can get on the right side of the market. This is not intended to be criticism, but rather a request.
Those benchmarks are minimum targets to cover and do not reflect severely oversold conditions.