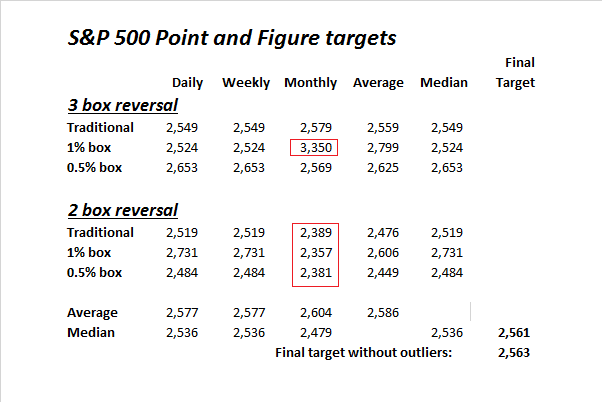
Mid-week market update: Back on July 19, 2017, I wrote about using point and figure charting as a way of projecting an upside SPX target when the index stood at 2473 (see What’s the upside target in this rally?). Using different sets of inputs that represent different time horizons and risk tolerances, I arrived at a target range, and a median upside target of 2561. The final targets were roughly the same whether outliers (highlighted in red) were removed or not.
Now that the index is within about 1% shy of the median target, what now?
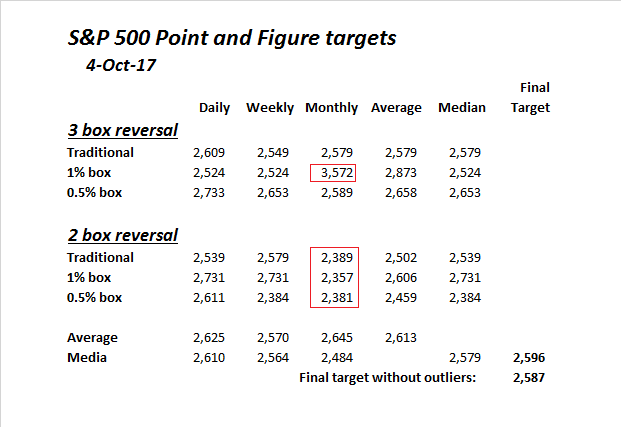
Revised targets
I re-ran the point and figure charts on stockcharts.com and came up with some updated targets, with the outliers highlighted in red. The upside objectives are now about slightly higher. The new final target range is now 2587-2596, up from 2561-2563.
The Rule of 20
Another way of thinking about a price target is Ed Yardeni’s Rule of 20, which calculates a target P/E ratio by subtracting headline CPI inflation from 20. Yardeni credits the rule to his friend and former CJ Lawrence colleague Jim Moltz.
The latest CPI inflation rate is 1.9, which make the target P/E ratio 18.1. Factset reports that the forward P/E is 17.7. Based on those figures, we can then derive a Rule of 20 price target of about 2600.
Limited upside potential
Surprisingly, these two wildly different estimation methods surprising arrive at very similar conclusions. I therefore conclude that the market advance is likely to start stalling at about 2600.
While these estimation techniques are inexact disciplines, this exercise does highlight limited upside potential in stock prices. Momentum is strong, and there is undoubtedly there are further gains for equity investors, but the party may be starting to wind down.
Frothy sentiment
BAML recently updated their “Sell Side Indicator”, which uses Street strategists’ asset allocation as a contrarian signal, and flashed a surprisingly bearish message. The standard interpretation of the Sell Side Indicator uses a 15-year rolling average of the Street consensus. Current readings are neutral, though they have risen quite rapidly.
However, the BAML strategy team found that shortening the time frame from 15 to 4 years yielded a far more cautious picture.
While we view the 15-year rolling periods as appropriate for capturing secular shifts in sentiment, we have found a better historical track record for sell signals based on shorter time horizons. Specifically, the model yields the lowest expected 12-month returns and higher percentage of negative returns when using a four-year rolling history.
Current readings are at a crowded long: “The current indicator near a six-year high, it is nearly two standard deviations above the four-year average, suggesting weaker returns over the next 12 months”. Note that the backtested results in the table below shows returns when they are 1 standard deviation above the 4-year average.
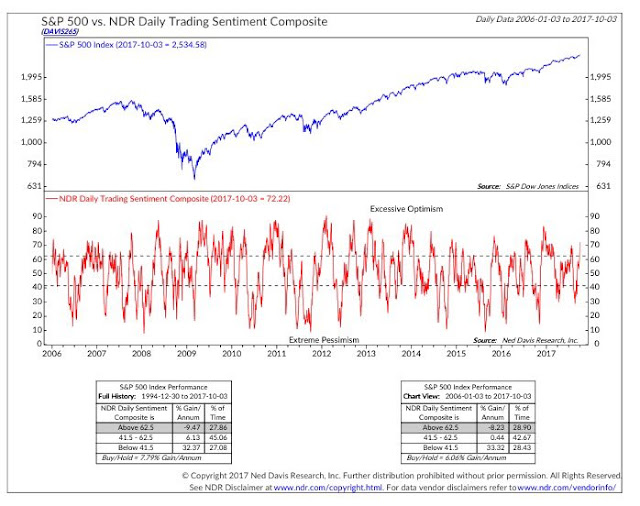
From a short-term viewpoint, sentiment is getting a little giddy and short-term upside potential may be limited. Ned Davis Research`s Trading Sentiment Composite is in the excessive optimism zone. Historically, the market has struggled when readings have been this high.
The Fear and Greed Index exceeded 90 this week, which represents an extremely greedy reading. Even if you are bullish, are you sure you want to be buying here?
My base case scenario calls for a short-term consolidation or pullback from current levels. The market is likely to then continue grinding upwards towards its ultimate top after a pause. These conditions suggest that investors and traders should refrain from getting overly greedy at these levels.
Disclosure: Long SPXU


1.9 minus 20 equals 18.1 not 19.1
Thank you for spotting the typo. It has now been corrected.
By very recent standards, today was an awful day for the S&P 500. It only advanced by 12 bp. What is the world coming to? That only works out to about 35% annualized, assuming 252 trading days in a year.
On Seeking Alpha, in his Oct 1 column, Jeff Miller notes ‘Bullish sentiment declined markedly. Bespoke notes the largest weekly decline since May to 33.3%. It has been below 50% for 143 weeks. For those who believe in this as a contrary indicator, it is quite bullish. It also calls into question the frequently-heard claim that investors are “complacent.” ‘
This seems at odds with the sentiment data from NDR in this column.
Cam
Check this link;
http://www.marketwatch.com/story/this-is-why-the-bull-market-can-keep-running-for-years-even-if-investors-dump-stocks-2017-09-29
Brian Reynolds, has been spot on during this entire period from 2009, till today. What he has written makes sense and is perhaps worth considering. As long as money printing is on globally, corporate credit is cheap and plenty and yield curve does not invert, bull market remains intact. He is hard to follow, as he is in the press infrequently.
Furthermore, probability of a 3-5% pull back is remote (see market action in the recent past). It is true, however, that the longer one goes without such a pullback, the more likely a 3-5% pullback.
That said, probability of a 15-20% pull back is even more remote (if the above factors remain intact). Here is the way I see it:
As long as money printing goes on, yield curve does not invert, VIX index remains in the dumps, and tax cuts are being talked about, bull market remains intact.
Expounding on Brian Reynolds’s missive, if tax cuts in the US become a reality, corporations may be able to repatriate upto 2 Trillion$. Even if 50% of that is repatriated, stock market may benefit by say 1 Trillion multiplied by a factor of 2-3. I have used a factor of 2-3, as that would be the leverage companies may be able to generate with 1 Trillion cash. Some of that leverage would come in form of borrowed capital, share buy backs and dividends.