I have spent a lot of time in these pages writing about the influence of macro-economic factors on market analysis. Indeed, Matt King at Citigroup recently highlighted the growing importance of macro factors on the equity market (chart via Bloomberg):
[Please see Bloomberg story for chart]
Here are three key macro factors that I have been watching now for clues to the direction of the stock market and sector selection.
The yield curve
One common way to measure the yield curve is the spread of 10-year and 2-year Treasuries. A steepening yield curve, where the spread widens, is thought of as a bond market signal of rising economic growth and a flattening yield curve, where the spread narrows, is an indicator of slowing growth. In the past, an inverted yield curve, where the spread goes negative, has been a surefire indicator of recessions and equity bear markets.
What it`s saying now: The yield curve has been flattening and moved to a cycle low of 0.75% this week, but it is nowhere near an inverted state, which is a recessionary and bear market signal. In light of the slightly more hawkish tone from the Fed, I am monitoring the evolution of shape of the yield curve for signs of a stock market top.
In addition, the yield curve can be a useful signal for the relative performance of financial stocks. The chart below depicts the relative performance of the Bank Index against the market (black line) against the yield curve (green line). In the past, these two lines have show a close correlation with each other. Currently, we are seeing a second back-to-back negative divergence where bank stocks are outperforming while the yield curve is flattening. I interpret this as a warning against taking an excess overweight position in the sector.
It’s the exchange rate, stupid!
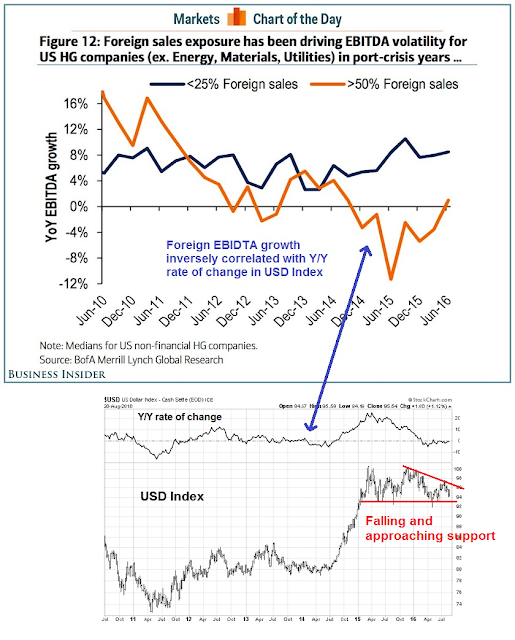
Business Insider recently featured analysis from BAML credit analyst Hans Mikkelsen showing that EBITDA growth for domestic companies with high grade credits have been flat for the last few years. By contrast, high grade credits with high levels of foreign sales have seen a high degree of EBITDA margin volatility. In other words, it’s all about the exchange rate!
In the chart below, I have overlaid the BAML analysis with the USD Index in the bottom panel. As the chart shows, EBITDA growth of companies with foreign exposure appears to be inversely correlated with the Y/Y change in the USD Index.
What it`s saying now: The USD has been weakening, which should give the earnings of multi-nationals a boost. However, the Dollar is now approaching a key support level. The market`s view of the intersection of the growth outlook and Fed policy will be a key determinant of future exchange rate movements (also see above discussion about the yield curve and growth).
Small caps and growth expectations
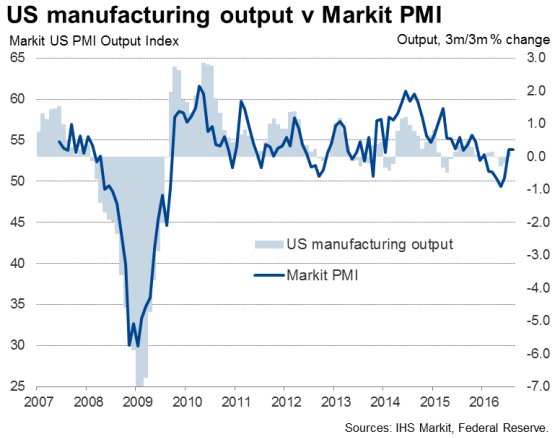
Regular readers know that I have been writing about the US undergoing a growth surprise for some time. Indeed, this chart of Markit PMI shows that economic activity is rebounding from the slowdown experienced last winter.
In a recent CNBC interview, market strategist Tom Lee issued a call to buy small cap stocks as a way of capitalizing on their economic torque, or operating leverage:
Investors have been rewarded for following signals in credit and derivatives markets this year, and a new one recently started sending a buy signal for small-cap stocks, according to Fundstrat Global Advisors co-founder Tom Lee.
“I think a really strong message is coming to buy small caps, because when economic data picks up and credit eases, small caps almost always win,” he told CNBC’s “Squawk on the Street” on Monday.
Jim Paulsen of Wells Fargo Asset Management had the same investment insight. Paulsen issued a call to buy small caps because of their operating leverage. In his case, he was making a bet on high inflation, which would disproportionately benefit small cap companies, but the idea is the same:
Essentially, small companies with tight profit margins, have greater “operating leverage” compared to larger companies. Thus, when inflation accelerates and selling prices can be raised, a larger portion of the enhanced selling price falls to the bottom line of narrow margin small cap companies. While disinflation is more challenging for small companies, rising inflation tends to boost both profit margins and earnings performance for small cap stocks relative to their larger brethren.
Indeed, the chart below shows the evolution of consensus forward 12-month EPS estimates in the top panel and the relative performance of small cap stocks in the bottom panel. This chart shows the close correlation between expected growth and the relative performance of small cap stocks, which is an illustration of their leverage to growth expectations.
In conclusion, this has been an illustration of the value of cross-asset analysis, which is also known as inter-market analysis. By identifying important cross-asset relationships and fundamental drivers of returns, changes in the pricing of one asset market can affect the returns of an entirely different asset class. It is also another way of showing how macro analysis is becoming important in the art of market analysis.


Great newsletter.
I still have a problem with the yield curve flattening as being a sign of recession ahead. In the past the flattening occured when both the long and short rates were rising but the short going up faster. That was in periods of overly strong economies causing the Fed to tighten by raising the Fed Funds rate.
Today the situation is completely different. As the curve has flattened, it’s because both rates have dropped but the long term one falling faster. The Fed is not tightening. So they will not be the cause of a recession like all the other periods.
Ken, thanks for your insight into inversion of yield curve, makes sense, especially the rate of GDP growth. Cam thanks for the article. I suppose small caps could be used as a proxy for the entire up move in the market.
Ken is correct. The yield curve is unlikely to invert without some active hand from the Federal Reserve. On the other hand, it may be flattening in anticipation of future Fed tightening action which slows the economy.