As we approach another FOMC this week, much of the short-term tone of the market will depend on the Fed. In order to analyze what the Fed is likely to do, let`s begin with their mandate, which is price stability (fighting inflation) and full employment. In addition, the Fed has taken on a third objective of financial stability.
When I look at what`s happened since the Brexit vote, all signs point to a renewed path towards interest rate normalization. Therefore it would be unsurprising to see the FOMC statement take a more hawkish turn. Expect the post-meeting buzz to focus on one or two rate hikes for the remainder of 2016.
The Phillips Curve
As the Fed`s stated dual mandate aims for both inflation fighting and full employment, their analytical framework is the Phillips Curve, which postulates a short-term tradeoff between unemployment and inflation.
Cost-push inflation is starting to rise from a tight labor market This graph from Tim Duy shows the relationship of between unemployment and wage growth, which eventually pressures inflation. The behavior of these two variables in the current cycle hasn’t been very different from past cycles. With unemployment at sub 5% levels, rising wage growth (and therefore rising cost-push inflationary pressures) is to be expected.
A growth revival
For much of the winter, the Fed had been worried about an economic pause, or slowdown. In addition, instability from abroad, such as Brexit, added to concerns about global financial instability. Much of those worries are now receding.
We can think of the American economy can be divided into two parts, the industrial, or manufacturing, economy and the consumer economy, which is proxied by consumer spending and employment. The industrial economy appears to be undergoing a growth revival, as evidenced by the upside surprise of the Markit Manufacturing PMI (Purchasing Managers’ Index).
As for the consumer, Bloomberg highlighted analysis from Macquarie, which used the components of Atlantic Fed’s GDPNow, to show that Q2 personal consumer expenditure is expected to surge to 4.5% quarter-over-quarter. In other words, the consumer is back and spending!
In addition, initial jobless claims continue to make progress. Last week’s release of initial claims beat market expectations again and the 4-week average fell to a new cycle low. This figure is particularly important as it coincides with the survey period for the July Non-Farm Payroll report.
As monetary policy is believed to operate with a lag, the combination of calmer financial markets, progress in growth and employment are expected to prompt the FOMC to return to a course of interest rate normalization. Undoubtedly, there will the usual caveats about “data dependence”, but expect a September rate hike to be back on the table. At a minimum, the market will expect that the Fed will raise rates at least once this year.
What to watch for
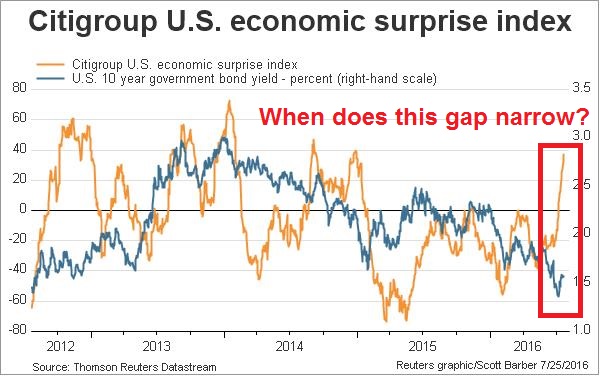
For equity investors, there are two metrics to watch. The chart below of the Citigroup Economic Surprise Index, which measures whether macro indicators are beating or missing expectations, and the 10-year Treasury yield shows a widening gap between the two. We have seen a growth surprise in the past few weeks, but bond yields have barely budged. Will bond yields rise in response to the FOMC statement?
The second metric to monitor will be the evolution of the shape of the yield curve. A steepening yield curve, where the 10-2 year yield spread widens, is the bond market’s signal that it expects rising growth, while a flattening yield curve is an indication of falling growth expectations. Assuming that the language of the FOMC indicates a return to rate normalization, will the yield curve steepen or flatten?
As the chart below shows, the circled yield curve inversions, where the 10-year rate is below the 2-year rate, have tended to lead equity bear markets. While the yield curve has been flattening, it is a long way from an inverted state.
At times like these, equity investors should pay close attention to the message from the bond market.


