Preface: Explaining our market timing models
We maintain several market timing models, each with differing time horizons. The “
Ultimate Market Timing Model” is a long-term market timing model based on the research outlined in our post,
Building the ultimate market timing model. This model tends to generate only a handful of signals each decade.
The
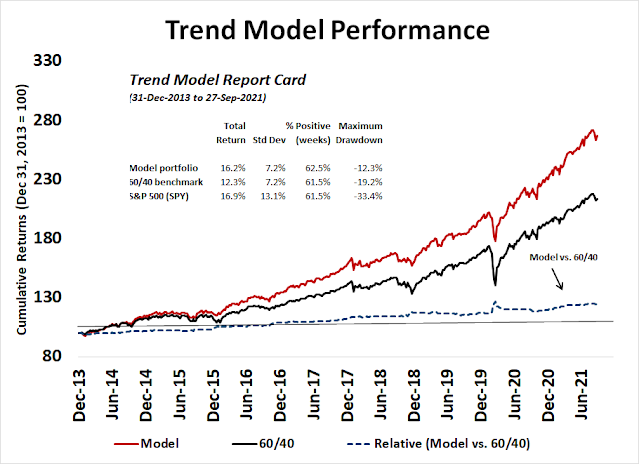
Trend Asset Allocation Model is an asset allocation model that applies trend following principles based on the inputs of global stock and commodity price. This model has a shorter time horizon and tends to turn over about 4-6 times a year. The performance and full details of a model portfolio based on the out-of-sample signals of the Trend Model can be found
here.
My inner trader uses a
trading model, which is a blend of price momentum (is the Trend Model becoming more bullish, or bearish?) and overbought/oversold extremes (don’t buy if the trend is overbought, and vice versa). Subscribers receive real-time alerts of model changes, and a hypothetical trading record of the email alerts is updated weekly
here. The hypothetical trading record of the trading model of the real-time alerts that began in March 2016 is shown below.
The latest signals of each model are as follows:
- Ultimate market timing model: Buy equities
- Trend Model signal: Bullish
- Trading model: Bullish
Update schedule: I generally update model readings on my site on weekends and tweet mid-week observations at @humblestudent. Subscribers receive real-time alerts of trading model changes, and a hypothetical trading record of those email alerts is shown here.
Subscribers can access the latest signal in real-time here.
Positive seasonality ahead
If history is any guide, stocks are expected to be bottom out in early October and begin a period of seasonal strength into year-end.
What are the odds of a melt-up for the rest of 2021?
A reflation bull?
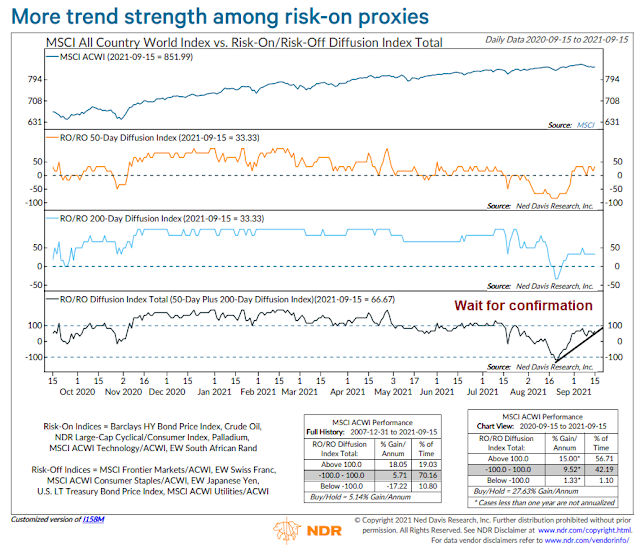
Ned Davis Research recently sketched out a bullish scenario into year-end for global equities by pointing out that Q4 has been the strongest in the last few years.
Their risk appetite indicators have been steadily improving, but the indicator hasn’t risen sufficiently to flash a buy signal just yet. These readings are consistent with my Q4 sector review which also found signs of cyclical and reflation strength, but no broad-based confirmation.
Supportive sentiment
The sentiment backdrop is becoming more supportive of an advance, though readings haven’t fallen to panic extremes. As an example, the 10 dma of the put/call ratio has spiked to levels where corrections have ended in the post-COVID Crash era, but the ratio has been higher in the past.
The NAAIM Exposure Index, which measures the sentiment of RIAs, plunged last week but readings are not below the 26-week Bollinger Band. A penetration of the low BB has been strong buy signals in the past.
These conditions lead me to believe that risk/reward is tilted to the upside. The maximum drawdown of the S&P 500 from its highs is -5%. It’s conceivable that prices could pull back further, but another 2-3% of weakness is likely to spark panic levels in many sentiment models.
Bullish tripwires
While I am cautiously bullish, I am not ready to go all-in just yet. Here are some bullish tripwires that I am watching as signs of a reflationary rebound. The blogger Macro Charts argued that energy stocks are the canaries in the cyclical coalmine.
A
Bloomberg headline came across my desk last week that may confirm the bullish outlook for energy: “China Orders Top Energy Firms to Secure Supplies At All Costs”,
China’s central government officials ordered the country’s top state-owned energy companies to secure supplies for this winter at all costs, according to people familiar with the matter.
The order came directly from Vice Premier Han Zheng, who supervises the nation’s energy sector and industrial production, and was delivered during an emergency meeting earlier this week with officials from Beijing’s state-owned assets regulator and economic planning agency, the people said, asking not to be named discussing a private matter. Blackouts won’t be tolerated, the people said.
The emergency meeting underscores the critical situation in China. A severe energy shortage crisis has gripped the country, and several regions have had to curtail power to its industrial sector and some residential areas have even faced sudden blackouts.
For some context, China isn’t suffering from an energy shortage. Skyrocketing coal prices have made the cost of electrical power production unprofitable and electric generation companies have cut output as a result. This means Chinese electrical generators will be buying coal at any price
Similarly, natural gas prices have soared in Europe because of a lack of renewable output. The sun hasn’t shone as much as expected and the atmosphere has calmed and wind power output has fallen. As natural gas is a feedstock into fertilizer production, this has put upward pressure on fertilizer prices and it will undoubtedly affect food prices as well.
On the other hand,
Bloomberg reported that core eurozone consumer sentiment remains surprisingly upbeat despite costs. Strong consumer demand in the face of rising prices is a bullish sign for the economy.
Supply chain bottlenecks
Won’t rising energy prices create inflationary pressure and force the Fed to act? Jerome Powell testified last week that inflationary pressures were expected to be transitory because of supply chain bottlenecks, but allowed that the transitory period may last longer than expected.
The headlines may see rising hysteria over shortages in the coming weeks as Christmas nears and products aren’t available in plentiful supply on shelves. In reality, the shortages are attributable to a supply shock owing to rising demand in the face of limited manufacturing and transportation capacity. Central bankers raising interest rates won’t make the semiconductor shortages go away, nor will it expand shipping and trucking capacity.
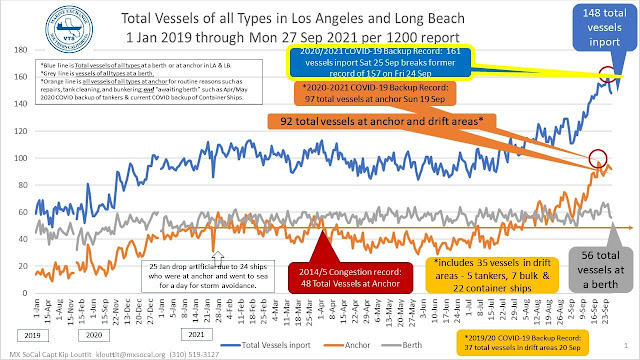
Some hopeful signs are starting to appear on the horizon on a bottom-up basis. The latest data on port congestion is showing possible signs of easing.
The best news from a contrarian perspective is this week’s cover of Barron’s.
Demand for services continue to improve. Airfare purchase are rising while refunds are falling.
New Deal democrat observed that manufacturing, or the producer side of the economy is performing well after assessing the August durable goods report.
Although there are many bottlenecks, in particular in transporting materials to factories, and goods from factories to sellers, orders for goods that will last a (relatively) long time continue to get better. There is simply no downward pressure on the producer sector of the economy at this time.
The next important data release will be the November Jobs Report. How will the juxtaposition of COVID cases, the expiry of emergency assistance programs, supply chain bottlenecks, and widespread reports of labor shortages affect the employment situation? Powell stated after the last FOMC meeting that it would take a large miss on the November report for the Fed to rethink its plans to taper its QE purchases.
This is what reflation looks like.
Fiscal wildcards
On the other hand, investors will have to deal with the confusing fiscal picture out of Washington. This time, there are simply a lot of balls in the air and many moving parts to fiscal policy. Each issue is separate but related and any one of them could go off the rails and affect fiscal policy and unsettle the markets.
- Funding the federal government, which can be done with a Continuing Resolution in the short run;
- The debt ceiling;
- The infrastructure bill; and
- The budget reconciliation process.
Here is how Biden’s $3.5 trillion proposals could affect future policy and change the lives of Americans:
- Transportation: Electric vehicle (EV) subsidies, spending for EV infrastructure like public charging stations, public transport subsidies, especially for rail travel.
- Healthcare: Expand Medicare coverage to dental, vision, and hearing benefits, free Medicaid coverage for more lower-income Americans, lower drug prices.
- Child Care and Education: Free daycare for lower-income Americans, two years of free preschool before kindergarten and two free years of community college, and 12 weeks of paid family leave to tend to a sick family member.
I have no idea of how this wish list will play out in the tug-of-war in Washington. Make no mistake that the legislative skills are there for a deal to be done. House Speaker Nancy Pelosi is a vote counter par excellence, Democratic Senator Majority Leader Chuck Schumer understands his caucus, and President Joe Biden enjoys a 90% approval among Democrats and he has a strong legislative record in the Senate.
In all likelihood, the Democrats’ ambitious agenda will be watered down. As an example, Biden’s original proposal was to raise the corporate tax rate from 21% to 28%, though expectations were scaled back down to 25%.
PredictIt odds show that the chances of no tax increase (21%) or a sub-25% tax rate are rising. As a 25% rate has been largely discounted by the market, a lower tax rate would be a welcome surprise for equity investors.
No analysis of fiscal uncertainty without a word on the German election. Angela Merkel’s CDU/CSU lost their leading status in the Bundestag and came second to the left-of-centre SPD. However, the SPD does not have sufficient seats to form a majority and it will need to seek coalition partners to form a government. The consensus expectation is a “traffic light” coalition of SPD (red), socially liberal but fiscally conservative FDP (yellow), and the Greens.

For investors, the key question is what happens to Germany’s traditional fiscal conservatism and propensity towards austerity. Both the SPD and Greens favor abandoning Germany’s “debt brake” while the FDP is adamant about keeping it. One trial balloon that has been floated is to give FDP leader Christian Lindner the finance ministry while allowing the Greens to execute their climate initiatives through off balance sheet spending. This solution allows Germany a fiscal boost to foster more growth, but it doesn’t address the issue of a common eurozone budget and greater fiscal integration. In the past, coalition negotiations can take a long time and the public won’t know the results for months.
In conclusion, the market may be setting for a period of positive seasonality into year-end, which would be sparked by a reflationary boom. However, a number of important cyclical tripwires have not been triggered. At a minimum and in the short-term, the S&P 500 needs to rally and regain the 50 dma though it is helpfully exhibiting positive RSI divergences as it tests the Evergrande panic lows.
Disclosure: Long SPXL


One thing always puzzles me is the relative (lack of) strength for markets that are commodity heavy since Mar 2020 pandemic low.
Both Australia (S&P/ASX 200) (+0.65% barely recovered from pre-Covid peak) and S&P/TSX (+13%) underperformed S&P500 (+29%)
Value/cyclical over growth should see markets like these outperform the US with heavy weighting in tech/growth sectors. But it actually lagged markedly.
Even during the recent episode of market pull back, the higher yield doesn’t benefit the cyclical/banking heavy S&P/ASX200 (-5.8% since mid-August) vs S&P 500 (-2.8% over the same period). It actually significantly underperformed yet again under a narrative of rising inflation/higher yield, which is meant to be supportive of cyclicals and banks).
Scratching my head as to why the inconsistency. Is there something more to be concerned about for markets, in general, going forward?
Money flows into the commodity countries cause the exchange rates to strengthen, which brake the stock prices. But country ETF values should perform better, since exchange rate is included.
It is about the size of the markets. US is 55% of the world. The world is awash with money. Most of it goes to US markets. It is very hard to repeat the commodity supercycles like in the old days. The economy today is much different now.
Blame Evergrande.
If there is a slowdown in real estate construction in China, and there has been worries about Evergrande for quite a while, then less construction = less use of copper steel cement etc…so this could put a damper on commodity countries
Great response (as always) to the question I posed yesterday – thanks, Cam.
https://www.scmp.com/business/banking-finance/article/3151072/evergrande-property-management-arms-shares-suspended
The ETFs holding the largest number of Evergrande shares (based on info I’m able find) appear to be iEMG and FXI.
SPX is in a pretty obvious downtrend. I would investors to start selling just because the downtrend in the indices is so obvious. Still a long way to go to the 200-day MA.
Scaling back into VT ~101.5x.
Friday’s low for VT was 101.30. Let’s see if it holds.
101.36.
Closing the position ~101.4x. My conviction level waned as prices breached 101.30. Intraday low at this point was 101.16.
Turning ugly. One of those days where I simply get out of the way.
Retest of Friday’s lows. I don’t think anyone expected a retest this soon following Friday’s rally.
SPX has undercut Friday’s low and now attempting to reclaim 4300.
Reopening VT ~101.2x on a bet the markets recover. Stop loss ~101.05.
VT closed.