Preface: Explaining our market timing models
We maintain several market timing models, each with differing time horizons. The “
Ultimate Market Timing Model” is a long-term market timing model based on the research outlined in our post,
Building the ultimate market timing model. This model tends to generate only a handful of signals each decade.
The
Trend Asset Allocation Model is an asset allocation model that applies trend following principles based on the inputs of global stock and commodity price. This model has a shorter time horizon and tends to turn over about 4-6 times a year. The performance and full details of a model portfolio based on the out-of-sample signals of the Trend Model can be found
here.

My inner trader uses a
trading model, which is a blend of price momentum (is the Trend Model becoming more bullish, or bearish?) and overbought/oversold extremes (don’t buy if the trend is overbought, and vice versa). Subscribers receive real-time alerts of model changes, and a hypothetical trading record of the email alerts is updated weekly
here. The hypothetical trading record of the trading model of the real-time alerts that began in March 2016 is shown below.
The latest signals of each model are as follows:
- Ultimate market timing model: Buy equities
- Trend Model signal: Bullish
- Trading model: Bullish
Update schedule: I generally update model readings on my site on weekends and tweet mid-week observations at @humblestudent. Subscribers receive real-time alerts of trading model changes, and a hypothetical trading record of those email alerts is shown here.
Subscribers can access the latest signal in real-time here.
The S&P 500 tests overhead resistance
The S&P 500 has been trading sideways since mid-April, with overhead resistance at roughly the 4200 level. While the market action in the past week has been frustrating for both bulls and bears, I believe the index should be able to advance past the 4200 level to test the old highs and probably make marginal new highs in early June. My bullish view is supported by the behavior of the VIX Index, which has convincingly fallen below its 20 dma after recycling from above its upper Bollinger Band.
Short-term bullish
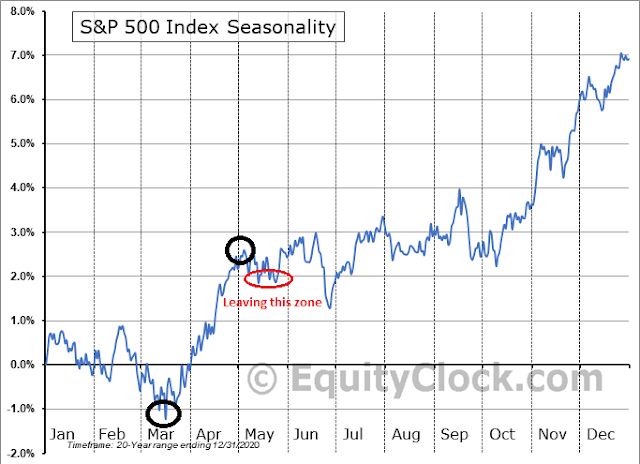
So far, the S&P 500 seasonality is tracking well this year. We have seen a March low, followed by an April rally and weakness in May. If the market continues on this roadmap, the index should correct in late June after it rises to an all-time high in the next two weeks.
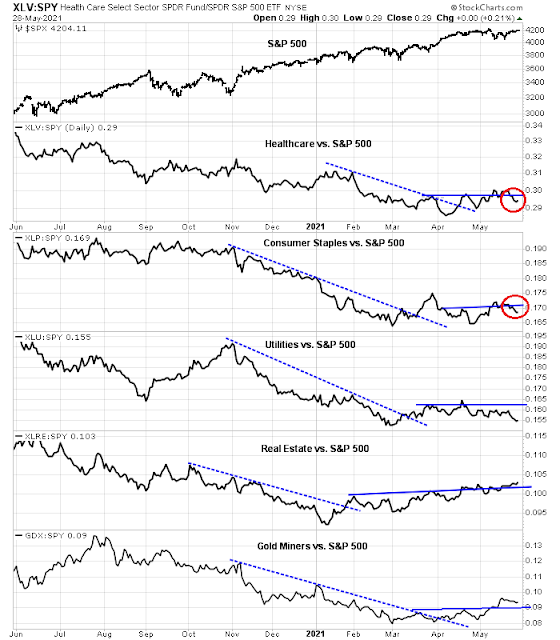
As well, the relative performance of defensive sectors have weakened and several have violated relative support levels. These are signals that the bulls have regained control of the tape.
A different kind of rally
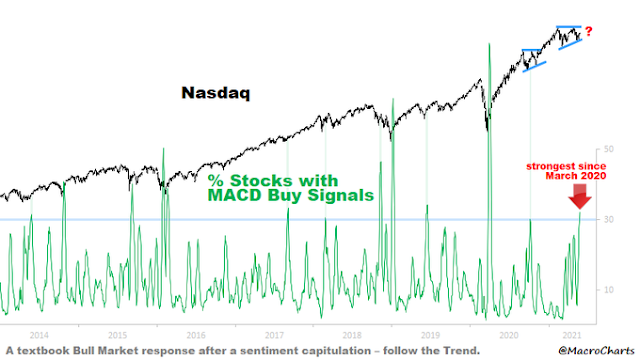
Macro Charts pointed out that one-third of NASDAQ stocks have flashed MACD buy signals, which is another important indicator of underlying strength.
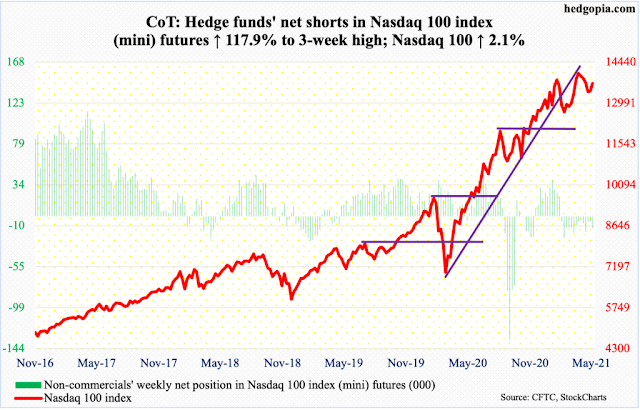
Hedgopia pointed out that large speculators (read: hedge funds) are still net short the NASDAQ 100 futures. Growth stocks are poised to climb the proverbial Wall of Worry.
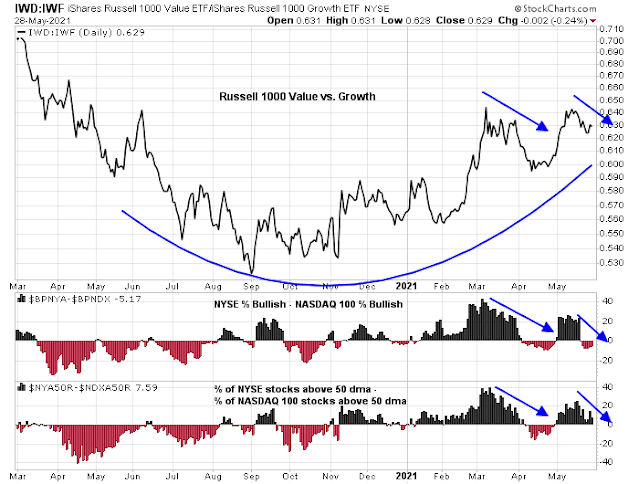
When might the growth stock rally end? Keep an eye on market breadth, such as the percentage of NASDAQ 100 stocks above their 50 dma or the NASDAQ McClellan Oscillator, to reach overbought levels as signals to become more cautious.
In light of the rising underlying strength in NASDAQ 100 names but a negative RSI divergence in the S&P 500, the S&P 500 may move sideways in the next two weeks while the market undergoes an internal rotation from value to growth.
One important test of market psychology will occur Friday with the release of the May Employment Report. As a reminder, the market had expected the gain of 1 million jobs in April and there were whisper numbers that Non-Farm Payroll would come in as high as 2 million. Instead, NFP inexplicably missed expectations with at 266K print. There is a good chance the April figure would be revised substantially upwards and the May NFP gain could bounce back with a gain of over 1 million jobs against a more modest expectation of 620K. How will the stock market react under such a scenario. Will good news be good news or bad news?
In summary, I believe the stock market is poised for additional advances in early June. Expect value stocks to take a breather, and a counter-trend rally by the lagging growth names. However, be prepared for the possibility for the S&P 500 to churn sideways for the next two weeks as the market undergoes an internal rotation from value to growth stocks.
Disclosure: Long SPXL




As a professional trader I am getting a bit cautious here. The number of stocks above their 50 day moving average on the S&P 500 is diverging quite a bit:
http://www.indexindicators.com/charts/sp500-vs-sp100-stocks-above-50d-sma-params-6m-x-x-x/
There is possibility that there might be a short squeeze in the dollar and also VIX is extremely oversold. Both worrisome signs for Gold and the overall market.
One sector that I traded last week was the bio-technology (XBI) from the long side. It is washed out and could provide a good risk reward for traders and investors.
The resorting of the huge MTUM Momentum ETF where Growth stocks were sold and Value stocks bought might have been a short term peak of Value versus Growth. Most ETFs mirror a certain index as does the MTUM. There would be many institutions that are using the same index independently to save fees and they would have also resorted.
My guess is that the strong jobs number will send interest rates higher and favor economically sensitive Value over Growth. The leading indicator will be ARK ETFs. They move extremely both ways as Growth goes in and out of favor. The rally from $100 looks pretty anemic compared to the huge drop from the peak and is at overhead resistance from various declining moving average lines. To me, this looks like a major decision point. Is Innovative Growth a bubble that has popped and heading much lower as in the Dot.com Crash or has it just paused before heading to new highs in a new wave of optimism? The two possibilities will be played out now. Here is the chart with moving average lines. What do you think?
https://refini.tv/3k2fMsM
Yeah Ken, rebound ARK is quite weak, it’s not bode well for growth sector…
Re: the S&P Seasonality Chart: Why does the old adage say “sell in May and go away?”
I’d like to share an observation which might shed lights on current and future econ growth. If you go to Youtube you can find some clips about a new generation of young people in China called “Lying Flat Tribe.” The cohort is growing very rapidly, and the influence is worrisome to CCP. CCP is adopting old USSR tactics trying to rectify it. But as in old USSR it is going to be fruitless.
There have always been similar groups in Western Europe and America. But I think at this juncture this has the potential to become the biggest impediment to future econ growth. COVID19 and gov response has had a big influence on people. A large group of people will rethink about life and goal and decide to become the same cohort in China.
I have seen this in Japan and South Korea where there are a lot of business catering to singles who have no aspiration at all in life, don’t work much or don’t work at all, no plan to have family, etc. It might start in Taiwan, US, …, everywhere. Why go to work or work so hard. For what?
Quite interesting, Ingjiunn! I remember reading about this happening a long time ago in Japan. While this does happen in the West, we are much more diverse: freedom to succeed == the freedom to fail. Much fatter distribution of outcomes.
We are living through this in Silicon Valley where the homeless and Masters of the Universe are literally neighbors.
https://www.schwab.com/resource-center/insights/content/signs-inflations-surge-is-transitory
There may be early indications of a thaw in inflation. Would this mean bond yields may not rise as fast as once thought?
Would this be bullish for tech?
The Consumer Price Index (CPI) for April was released last week and it was a doozy:
Headline CPI +0.8% month/month (largest jump since June 2009)
Headline CPI +4.2% year/year (largest jump since September 2008)
Core (ex-food/energy) CPI +0.9% month/month (largest jump since September 1981)
Core CPI +3.0% year/year (largest jump since January 1996)
A look back to 1958 at both headline and core CPI is in the chart below. In terms of the April data, the miss (relative to expectations) for headline CPI was 5.0 standard deviations above the norm, while the miss for core CPI was 6.0 standard deviations above the norm.
https://www.schwab.com/resource-center/insights/content/world-inflation-transitory-or-more-nefarious
Inflation may be here for some time to stay. Gold, Energy and commodities may be the place at least for a few quarters. See the bar chart in the next link.
https://www.schwab.com/resource-center/insights/content/inflation-expectations-are-up-should-investors-worry
https://www.schwab.com/resource-center/insights/sites/g/files/eyrktu156/files/styles/embedded_700/public/inflation%20chart%20more%20than%204%20percent.png?itok=lKA0CvGq
https://www.cnbc.com/2021/05/04/momentum-etf-could-add-financials-energy-in-rebalancing.html
When do we find out what changed at MTUM? Thanks.
Didn’t Ken post the changes under an earlier post?
When it comes to trading the financial markets, there is no shortage of opinions. There will always be a significant chance that any given opinion will be wrong – maybe even way off base. Always have a contingency plan in place.
Spot on Rx. Truth be told, most of main plans seem way off base!! Lol.
Realized Sale Activity Summary 3/3/2021 – 6/1/2021 Created: 6/1/2021 7:49:00 AM
Security
Security Name | Symbol Units Orig Cost WS Adj Cost Basis Proceeds ST Gain/Loss LT Gain/Loss % Change
[View Security Details] DIREXION DAILY GOLD MINERS (NUGT) 15,000 $992,629.76 $992,629.76 $1,068,570.79 $75,941.03 7.65%
[View Security Details] DIREXION DAILY S&P BIOTECH (LABU) 5,000 $318,000.00 $318,000.00 $338,047.68 $20,047.68 6.30%
[View Security Details] DIREXION DAILY SEMICONDUCTO (SOXL) 65,581 $2,258,009.92 $2,258,009.92 $2,322,571.20 $64,561.28 2.86%
[View Security Details] DIREXION DAILY SEMICONDUCTO (SOXS) 5,016 $50,854.50 $50,854.50 $51,057.81 $203.31 0.40%
[View Security Details] DIREXION DAILY SMALL CAP BE (TZA) 10,000 $345,750.00 $345,750.00 $326,497.14 $-19,252.86 -5.57%
[View Security Details] PROSHARES ULTRAPRO QQQ (TQQQ) 5,100 $561,922.85 $561,922.85 $570,754.49 $8,831.64 1.57%
TOTAL (6 securities) $4,527,167.03 $4,527,167.03 $4,677,499.11 $150,332.08 3.32%
Nicely done.
1. You managed to capture significant gains trading the biotechnology sector on the long side.
2. You traded the semis in both directions.
3. Most impressively, you employed leveraged ETFs for the majority of your trades. The ability to handle that kind of volatility has always eluded me!
Just to prove a point I put my money where my mouth is.
Taking swings at TLT/ QQQ/ PLTR.
XLV.
All positions off for minor gains.
I don’t trust the market at these levels, and will take gains when I have them.
Back in TLT.
Based on Cam’s post + the fact that it’s one of the few assets that may be attractively priced right now.
Smaller play on GDX.
Taking a shot at VTV on the midday pullback.
All positions off.
Minor gains on TLT/ VTV. Minor loss on GDX.
I am not going to write any more in future. NOt worth the hassle.
Stocks Suddenly Puke As VIX Rebounds From Mini-Flash-Crash …….Zero Hedge
https://www.marketwatch.com/story/china-reports-first-known-human-case-of-h10n3-bird-flu-01622559215?mod=mw_latestnews
Reopening TLT here.
Adding a position in QQQ here.
Adding to QQQ.
Third and final tranche to QQQ.
Holding positions overnight.
Should I assume that the GDX buy recommendation is cancelled now that SPXL is the new buy???
Still long GDX in the investment account. SPXL is a trading position.