Mid-week market update: What should traders make of this stock market? On one hand, the S&P 500 is exhibiting strong positive price momentum. Not only is the index trading above its daily Bollinger Band (BB), it’s trading above its weekly BB. In the last 10 years, there have been eight occasions when the S&P 500 was above its weekly BB. Most (five out of eight) of those instances were associated with sustained advances indicative of positive price momentum. The market corrected in three of the eight occasions, but in one of the three corrections (in early 2018), the upper BB ride persisted for three weeks before the market exhibited a blow-off top. That’s what strong price momentum looks like.

On the other hand, short-term sentiment is off-the-charts bullish, which is contrarian bearish.
Strong momentum
I have highlighted this chart before. The percentage of S&P 500 stocks above their 200 dma is well over 90%. In the past, this has been a sign of a “good overbought” market advance. The market often didn’t pull back until the weekly RSI became overbought or near overbought, as it is today.

Sure, the market is overbought but that hasn’t stopped stock prices from rising in the past. In the last year, there have been occasions when the market advanced while flashing a series of overbought signals. The readings from this chart are based on last night’s close and today’s sideways consolidation is expected to relieve some of the overbought conditions and set the stage for a further advance.

Crowded long bullishness
Before the bulls get too excited, a couple of (unscientific) Twitter polls conducted on the weekend raised some concerns. While these polls have definite self-selection sampling problems, they have been good indications of short-term trader sentiment in the past.
First, Helene Meisler’s latest bull/bear Twitter poll has sentiment at a record level of bullishness, though the history is somewhat limited.

The level of excessive bullishness was confirmed by a similar weekend poll conducted by Callum Thomas, which also shows a very high level of equity bullishness.

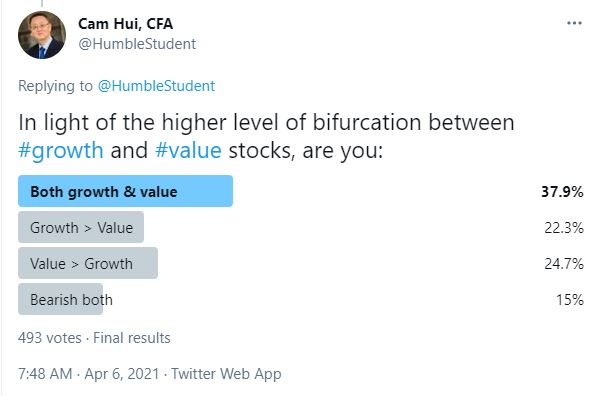
I have pointed out before that the stock market has bifurcated into two markets, growth and value stocks. There has been some recent internal rotation between growth and value. Value leadership has paused and growth stocks have staged a recent counter-trend rally. The Russell 1000 Growth Index has filled in a February gap and it is now approaching overhead resistance.

I conducted my own (unscientific) Twitter poll to see if respondents were bullish on growth or value stocks. My own poll confirmed the low level of bearishness and the level of bullishness between growth and value were roughly similar.
Squaring the circle
How do we square this circle of strong momentum and crowded long sentiment readings?
The bullish interpretation is the S&P 500 is undergoing a melt-up. It is trading above both its daily and weekly upper BB while exhibiting a series of “good overbought” RSI readings. In the past, such rallies have not ended until the market exhibited a blow-off top by overrunning its upper rising trend line. If I had to guess, the upside target for this rally is in the 4140-4160 range.

Also, keep in mind that next week is April option expiry. According to Rob Hanna at Quantifiable Edges, April OpEx has the strongest bullish risk/return of any month.

The bearish interpretation is internals are failing, sentiment is too bullish, and this market can correct at any time.

My inner investor remains bullishly positioned. The intermediate-term trend is still up, and he is not overly worried about minor blips in stock prices. At worse, any S&P 500 weakness shouldn’t exceed -5%. My inner trader is also bullish, but he is bracing for volatility and preparing to exit his long position on the first signs of weakness.
Disclosure: Long IJS
It really is a tough call right now – but there is no indication that markets are about to sell off.
It helps to have trades on with multiple time frames. RYGBX and GDX are longer-term trades based on extreme negative sentiment. VIAC/ DISCA/ IQ are trades in which I’m building positions for what will hopefully be LT gains. Everything else is ST. Positions in FXI/ ASHR/ EEM opened yesterday based solely on their opening gaps down.
Adding to XLE.
Reopening starters in VTV/ XLI/ JETS.
Adding to KRE.
Restarter in XLF.
Still laddering into VIAC/ DISCA.
Opening positions in HIMX/ NIO.
AA.
CGC.
Adding to IJS.
PLTR.
TLT is finally headed in the right direction!
PAVE.
EFV.
Small position in RYSPX at the 730 am – just in case the markets decide to spring a melt-up when least expected (ie, today).
Small position also in RYRHX (Rydex Russell 2000) at the 730 am window.
AMRS breaking out. Taking a position ~17.19…
Adding.
Looks like the breakout was faded. I’ll hold my current position and wait it out.
IBB.
At this point, is there any doubt we’ll see 4100? The question is whether we’re able to hold above.
Adding positions in RYDHX (Rydex DJIA)/ RYZAX (Rydex Value)/ RYEIX (Rydex Energy) at the close.
It appears that the market is climbing a wall of worry.
The way I would resolve the momentum/ sentiment debate:
(a) There is strong momentum.
(b) Sentiment may not be as bullish as it seems. Many investors are in fact bullish (and will report themselves as such) – yet reluctant to go all in until the much-anticipated pullback occurs.
I am eager to see if the sentiment reset will go the same way as in 01/2018. After OPEX party the hangover may began.
Lots of chop in this market.
Adding to positions in EEM/ FXI/ ASHR/ GDX this morning.
Opening positions in VEU and PICK.
AMRS back above the breakout point.
Cutting back on exposure where I have gains.
Closing GDX. Closing PAVE. Closing PLTR. Closing HIMX.
Closing XLI. Closing IWM.
Closing KRE/ XLF.
Actually investors are seeking the relative safety of big cap tech, whereas everyone else will have to deal with cost pressure. Bond yields may continue to trend towards 2%, but that won‘t kill AAPL, FB, GOOG and MSFT here. It may affect the more speculative ARKK stocks more.