Preface: Explaining our market timing models
We maintain several market timing models, each with differing time horizons. The “
Ultimate Market Timing Model” is a long-term market timing model based on the research outlined in our post,
Building the ultimate market timing model. This model tends to generate only a handful of signals each decade.
The
Trend Asset Allocation Model is an asset allocation model that applies trend following principles based on the inputs of global stock and commodity price. This model has a shorter time horizon and tends to turn over about 4-6 times a year. In essence, it seeks to answer the question, “Is the trend in the global economy expansion (bullish) or contraction (bearish)?”
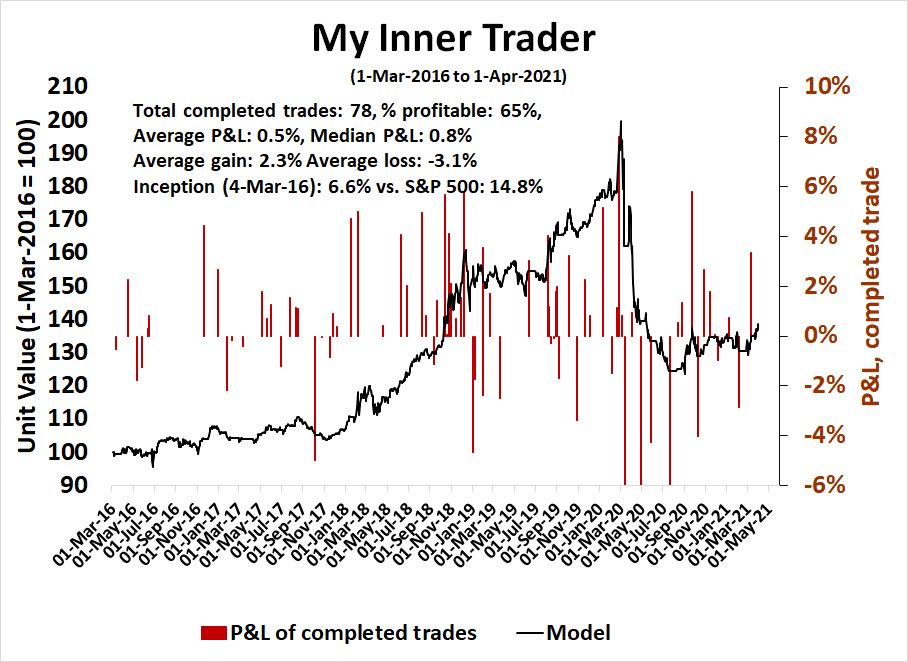
My inner trader uses a trading model, which is a blend of price momentum (is the Trend Model becoming more bullish, or bearish?) and overbought/oversold extremes (don’t buy if the trend is overbought, and vice versa). Subscribers receive real-time alerts of model changes, and a hypothetical trading record of the email alerts are updated weekly here. The hypothetical trading record of the trading model of the real-time alerts that began in March 2016 is shown below.
The latest signals of each model are as follows:
- Ultimate market timing model: Buy equities
- Trend Model signal: Bullish
- Trading model: Bullish
Update schedule: I generally update model readings on my site on weekends and tweet mid-week observations at @humblestudent. Subscribers receive real-time alerts of trading model changes, and a hypothetical trading record of those email alerts is shown here.
Subscribers can access the latest signal in real-time here.
The revenge of the tech nerds?
A reader pointed out an unusual market anomaly last week. Market leadership had shifted significantly some time during Q2 or Q3 2020. The old Big Three leaders of US over non-US stocks, growth over value, and large-caps over small-caps had made unmistakable trend reversals. Recently, even as the S&P 500, the Dow, and the Transports made fresh all-time highs, leadership was shifting back. US equities are dominant against non-US again; NASDAQ stocks are enjoying a minor revival; and small-caps are faltering against their large-cap counterparts.

Is this the start of a reversal, or just a blip?
The global big picture
Let’s begin with the global picture. An analysis of the relative performance of the different major regions against the MSCI All-Country World Index (ACWI) reveals a revival in the relative performance of the S&P 500. The major developed market regions, Europe and Japan, had been trading sideways against ACWI, and emerging market equities had weakened somewhat.
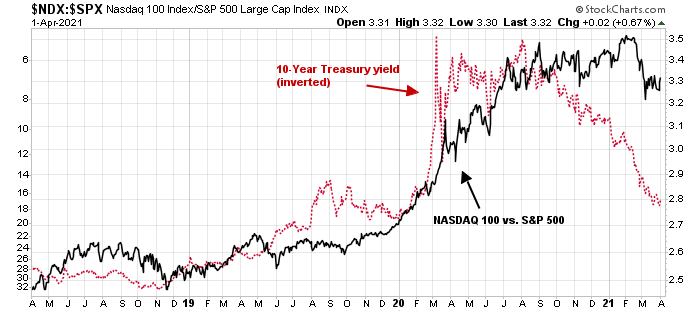
A more detailed analysis of the US (top panel) shows a significant divergence. Even as the S&P 500 had sprinted ahead on a relative basis this year, the NASDAQ 100 was flat to down against ACWI. The difference between the S&P 500 and NASDAQ 100 represents the difference between value and growth. It was the value factor that had been driving the recent US outperformance.
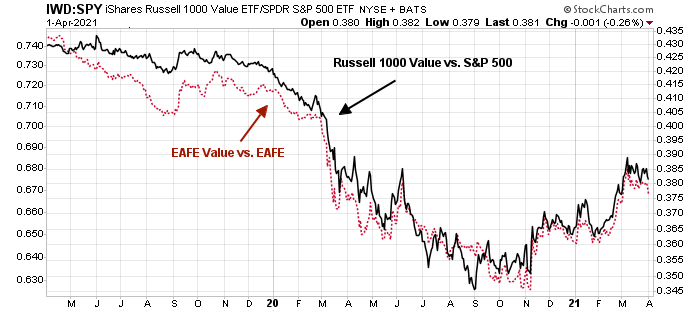
In fact, the relative return patterns of the Russell 1000 Value Index against the S&P 500 and the EAFE Value Index against the MSCI EAFE Index (Europe, Australasia, and the Far East) are virtually identical.
I interpret this to mean that there have been no recent significant global regional leadership trends, but the value factor has been dominant in global equity returns.
What about the reversal in small-cap stocks? An analysis of the global size factor reveals that small-caps have been rising against their large-cap counterparts in a steady but uneven fashion all over the world. The biggest laggards have been Chinese and Japanese small-cap stocks, which had been in relative downtrends until they began to outperform in the last two months.
The pause in US small-cap outperformance appears to be just that – a brief pause. The long-term leadership of non-US over US, value over growth, and small-caps over large-caps should continue.
The bond market wildcard
The one wildcard to the continued leadership scenario is the possibility of a bond market rally. The Treasury market has been clobbered recently, and here is why.
The chart below shows quarterly changes to the JPMorgan Forecast Revision Index, which measures how economic forecasts have changed either upward or downward over the course of the quarter. The recent upward lurch in the index was the biggest upward move in its entire history, indicating an unprecedented pace of expected economic growth. The expectations of a strong recovery have depressed bond prices.
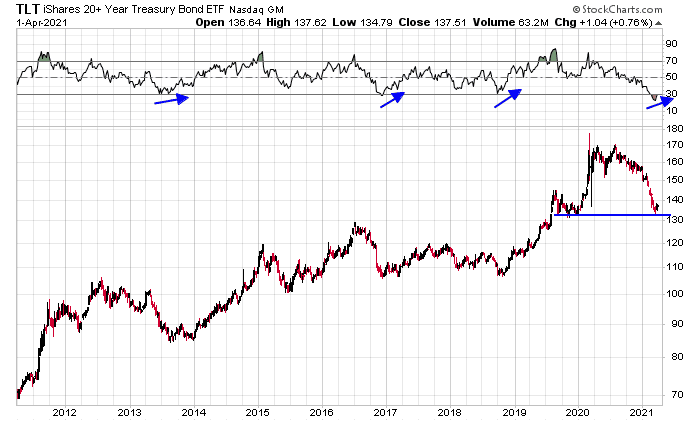
The long Treasury bond ETF (TLT) is testing support and exhibiting a positive RSI divergence. There have been three similar episodes in the last 10 years. Bond prices rallied strongly the last time this happened in 2018. On the other two occasions, the selloff was halted and the bond market traded sideways.
As well, the bear flattener reaction of the bond market to Friday’s blockbuster March Jobs Report was constructive. While yields did rise across the board, the yield curve flattened – there may be life in the long bond even in the face of bad bond market news.
As the relative performance of growth stocks is sensitive to bond yields, a bond market rally could provide the impetus for a reversal of value and growth factor returns.
A bull market
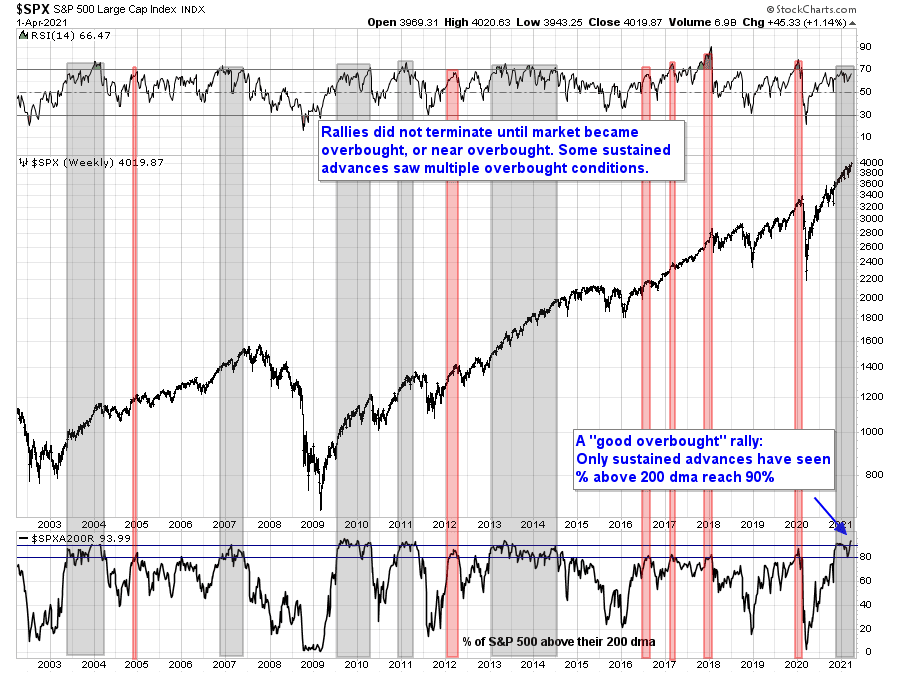
Regardless of what happens to equity factors, investors need to recognize that this is a bull market. There is nothing more bullish than a stock or index making new all-time highs. The Dow and Transports have made fresh highs, which is a Dow Theory buy signal. As well, the market is benefiting from the combination of strong positive price momentum and skeptical sentiment. The percentage of S&P 500 stocks is above 90% again, which is a characteristic of a “good overbought” market advance (grey bars).
The market is also enjoying a fundamental momentum tailwind. FactSet reported record upward EPS revisions for Q1 2021 earnings.
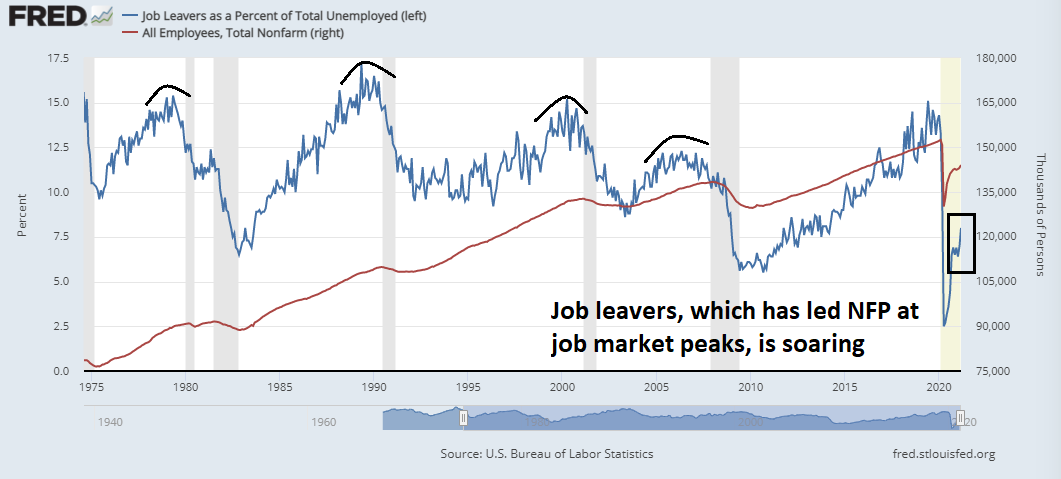
The market is also enjoying a top-down macro tailwind from the blowout March Jobs Report. Non-farm payroll employment soared by 916,000 against an expected 647,000. Average hourly earnings was tame, indicating no pressure from wage inflation. Equally important are the leading indicators of employment. As an example, the number of job leavers, which has historically led NFP, soared indicating growing confidence about the strength of the jobs market.
The bullishness in sentiment surveys is coming off the boil. Investors Intelligence bulls are declining, and so is the bull-bear spread.
More importantly, the NAAIM Exposure Index, which measures RIA sentiment, retreated to 52 this week. This index fell below its lower Bollinger Band in early March and generated a contrarian buy signal. The current reading is very near the lower BB. If NAAIM sentiment were to deteriorate further next week, it could flash another buy signal. These buy signals have been very effective in the past.
The trend is your friend
In conclusion, investors should heed the adage “the trend is your friend”. The first trend is the pattern of new highs. This is a bull market.
Despite some minor hiccups in factor return patterns, give the benefit of the doubt to the trend of value and cyclical leadership. The Rising Rates ETF (EQRR) represents a simple way of measuring the effects of value and cyclical exposure. Notwithstanding the possibility of a bond market reversal, the intermediate-term value and cyclical trends are still intact.
From a trader’s perspective, the reaction of the equity futures market to Friday’s blowout Jobs Report left S&P 500 futures +0.5% and Russell 2000 futures +2.0% on a fair market value basis. In all likelihood, the market will open strongly on Monday. While the S&P 500 did not experience a negative 5-day RSI divergence on Thursday, keep an eye on whether the VIX Index falls below its lower Bollinger Band in the week ahead. Such incidents have often been signals of short-term tops.
Both my inner investor and inner trader are bullishly positioned. While the market isn’t showing signs of being too extended just yet, my inner trader is watching for signs of excessive exuberance to sell.
Disclosure: Long IJS


Cam, further to your comment that International ex_US Value is doing fine, here is a momentum chart showing Fidelity’s International ex-US Value and the general International ex-US Index (VEU). Note how VEU (middle chart black line) started to underperform badly in mid-February when market weighted growth indexes broke down while the Fidelity’s Value fund kept marching higher.
https://product.datastream.com/dscharting/gateway.aspx?guid=1d958c71-2e0d-4211-82de-3f0cd7a3a161&action=REFRESH
This is another example of market weighted indexes underperforming equal weight and hence Value.
https://www.marketwatch.com/story/the-tom-brady-of-asset-management-people-love-to-hate-cathie-wood-but-her-funds-get-results-11617371226?mod=mw_latestnews
Here’s a contrarian take on ARKK – will be interesting to see how the fund plays out during the rotation to value.
Two recent Renaissance Macro interviews with CW here:
Discusses her background in the first, methodology/strategy in the second.
https://blubrry.com/renmac_off_script/
I think Wood’s methodology is sound. And She, as a person of faith, deserves respect. But her funds’ performance going forward largely depends on the investing public. Are investors in there for the long haul and trusting Wood to do a good job for them? Her funds are concentrated and quite a few of the holdings are not profitable. This will create volatility and test patience of her investors.
People always cite Peter Lynch’s performance, and try to compare Wood with Lynch . Today’s market is dramatically different and I think Lynch will have a hard time repeating the performance if he were to manage a fund today. It requires more analytical tools and different ways of thinking today, in a fiercely competitive environment on a time compression scale.
We all witnessed the affirmation of the use of big data and statistical tools in recent COVID19 vaccine development. So there is a good probability one can do it right in investing using similar approaches, provided your algos are sound.
I personally invested in ARKG, an area I know very little, for the long haul. I don’t like her new 3D printing and space exploration funds. And I have reservation about TSLA being cross-held by several funds of hers and at a large percentage. One other thing Wood will struggle with constantly is how to manage the fund flow. There is only mitigation but no solution. Preferably she is not trading so often. It erodes return and investors get a capital gain tax, not what long-term investors ask for.
https://www.barrons.com/articles/SB105070810693991300?tesla=y
Check out Helen Young Hayes from 2003, and a few years earlier!
Peter Lynch was the investment rock star of his time, and deservedly so.
By the time he wrote his best-selling book, it was time to move on to new approaches.
ARKK off to a strong start for Q2.
Personally, I’m having a hard time finding anything in the stock universe that looks good right now. Not exactly bearish, but neither does the market seem a compelling buy right now. It’s more the reverse of April 2020 – I think we need a hard correction before I’m willing to commit capital for longer than a day or two.
We’ve all worked hard to accumulate wealth. There’s no obligation to be in the market at all times. Nothing wrong with sitting in cash while waiting for prices to come in.
Taking another swing at VIAC.
DISCA as well.
All positions closed.
Opening a position in VXX.
Closing VXX after hours.
Reopening VIAC after hours.
VIAC off.
There is IMO only one asset class which exhibits the kind of sentiment that may support more than an intraday/overnight holding period.
Opening a position in RYGBX at the close.
Reopening positions in FXI/ ASHR/ EEM.
KRE.
XLE.
Laddering back into VIAC/ DISCA.
IJS.
BABA.
Adding to VIAC/ DISCA.
IQ.
GDX.