Mid-week market update: You can tell a lot about the tone of the tape by how it reacts to news. There is growing evidence that the stock market is becoming immune to good news, which is a signal of bullish exhaustion. In all likelihood, the near-term path of least resistance for stock prices is down.
The results from Q2 Earnings Season has been stellar. Experienced investors know that corporate management is plays the “beat the earnings” game well. According to FactSet, the average 5-year EPS beat rate is 68%. On the other hand, it’s harder to play accounting game with sales, as the average 5-year sales beat rate is only 53%. This quarter, sales beat rates are off the charts when compared to their historical experience.
FactSet‘s update of earnings from last Friday shows that forward EPS is being revised upwards as well. That should be good news for stock prices.
Instead, the SPX has been mired in a narrow trading range and it has been unable to stage an upside breakout to new highs.
The lack of a bullish impulse in response to positive news is a warning for the bulls.
Immune to good news
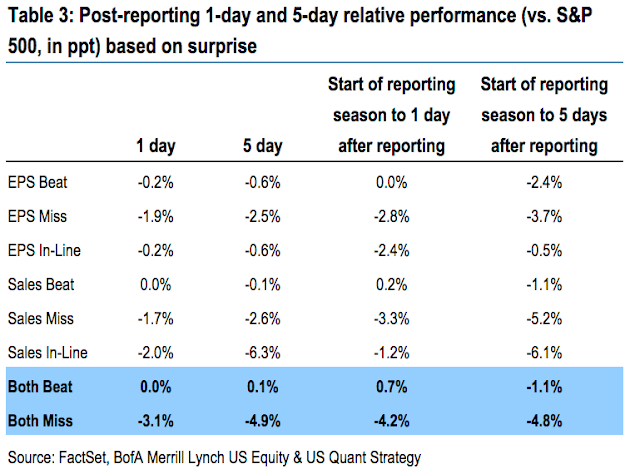
Business Insider highlighted analysis from BAML that showed the market is barely reacting to sales and earning beats, while punishing misses.
This asymmetric reaction function to news is an open invitation to some bearish catalyst to spark a downdraft in prices.
Bad breadth a drag on stock prices
Jeff Hirsch at Almanac Trader recently sounded a warning from a chartist’s viewpoint. He observed that the Advance-Decline Lines of major market indices appear to have peaked, which is bearish.
In the above chart appear DJIA, SP 500, NASDAQ and Russell 2000 indexes above Advance/Decline lines. NASDAQ and Russell 2000 Advance/Decline lines appear to have peaked last week and have turned lower. SP 500 and NYSE have turned flat and appear to be leaning lower. Generally, when the majority of and index’s components are declining the index already is doing the same or may soon do so.
We can observe a similar effect by analyzing the relative returns of the Russell 2000 small cap stocks against the megacap DJIA. Even as the Dow made fresh highs this week, small cap stocks weakened, indicating a negative breadth divergence.
Negative momentum
The Fear and Greed Index is also showing some ominous signs of intermediate term weakness. This index peaked recently at 81 and began to retreat to the current reading of 67. As the chart below shows, the market historically hasn’t bottomed until this index falls to a minimum of 40. We are not there yet.
In short, the stock market appears to be poised for a correction of unknown magnitude. While the fundamental are supportive of higher prices, the combination of a crowded long positioning and faltering price momentum indicates that traders should adopt a tactically bearish view on stock prices.
Disclosure: Long SPXU


