Mid-week market update: Since January, I have been saying that the stock market is extended and could pull back at any time. The latest conditions shows that the S&P 500 is consolidating sideways after pulling back from above its upper Bollinger Band. The stochastic has recycled from overbought to neutral, which is a tactical sell signal.
But the correction scenario could be a replay of the story of Lucy, Charlie Brown, and the football. For the uninitiated, Peanuts is a children’s comic strip. There is an iconic repeating scene where Lucy repeatedly plays a game of convincing Charlie Brown that she will hold a football for Charlie Brown to kick. Just as he runs up to kick the football, she pulls it away from him at the last second.
Historical reasons to be bullish
Still, momentum models are screamingly bullish. I am seeing a flood of historical studies that indicate bullish forward outcomes. Here is just one example.
Steve Deppe studied instances when the S&P 500 recorded its four consecutive close at a monthly all-time high.
Jeff Hirsch at Trader’s Almanac found a strong momentum effect when the months of November to March were all positive.
I could go on, but you get the idea.
Reasons for caution
However, there are good reasons to be cautious.
Ryan Detrick recently highlighted my analysis of the relative performance of defensive sectors and added that he will stay bullish until these sectors start to turn up on a relative basis. Here is the latest update of the chart.
Here is the contrarian view from Callum Thomas of
Topdown Charts. Defensive sector sentiment has become overly extreme and due for a reversal.
Over in Europe, investors are seeing a flood of ETF launches designed to embrace risk. This is not the sort of behaviour you see at market bottoms.
Andy Constan pointed out that the CBOE 3-month implied correlation index is at an all-time low. Here is how the
CBOE explained implied correlation:
Implied Correlation, a gauge of herd behavior, is the market’s expectation of future diversification benefits. It measures the average expected correlation between the top 50 stocks in the SPX index. Cboe calculates COR3M by using ATM delta relative constant maturity SPX index and component option implied volatilities.
Here is how to interpret the index:
Correlation quantifies the diversification benefit that any financial investor expects to earn when constructing a portfolio. Decreasing correlation reduces a portfolio’s overall volatility beyond the weighted average volatility of portfolio components, improving investor risk/return tradeoffs. Positive correlation spikes indicate lower expected diversification benefits, increased systematic risk, and a higher likelihood of experiencing extreme tail events associated with sudden market movements.
In other words, low correlation means that stocks aren’t moving together. When NASDAQ stocks began to stumble recently, value stocks began to rise, which showed up as low correlation. Should correlations rise in response to an unexpected event, investors could see a dramatic spike in volatility.
Indeed, the NASDAQ Hindenburg Omen flashed another warning yesterday and today. Clusters of Hindenburg Omens have historically signaled subpar short-term returns.
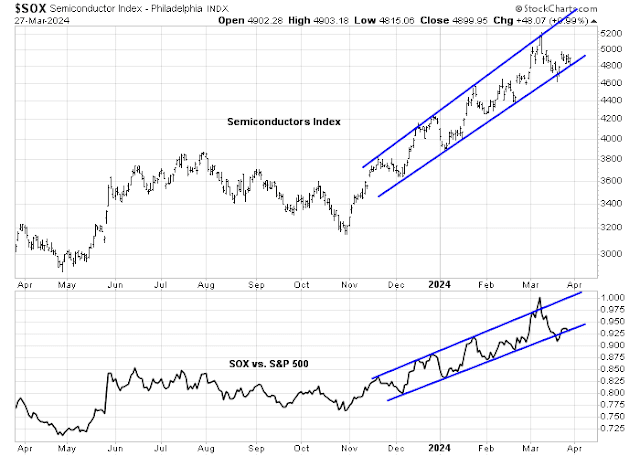
The semiconductor stocks, which are the bellwethers for AI-related plays, are perched on the edge of their absolute and relative trend lines. Further weakness could be a signal of fading enthusiasm or bullish exhaustion in the AI investment theme.
Continued caution
Putting it all together, I interpret current market conditions as long-term bullish and short-term cautious. The warnings I cited measure sentiment. Sentiment is an indicator of condition, such as an extended market, but it is not an actionable trading signal. You need a bearish trigger.
The bearish trigger could have arrive in the form of the recycle of the S&P 500 stochastic indicator, but this could be another case of Lucy and the football. The usually reliable S&P 500 Intermediate Term Breadth Momentum Oscillator (ITBM) remains on a sell signal when its 14-day RSI recycled from overbought to neutral.
My inner investor is bullishly positioned. My inner trader remains short the S&P 500. The usual disclaimers apply to my trading positions.
I would like to add a note about the disclosure of my trading account after discussions with some readers. I disclose the direction of my trading exposure to indicate any potential conflicts. I use leveraged ETFs because the account is a tax-deferred account that does not allow margin trading and my degree of exposure is a relatively small percentage of the account. It emphatically does not represent an endorsement that you should follow my use of these products to trade their own account. Leverage ETFs have a known decay problem that don’t make the suitable for anything other than short-term trading. You have to determine and be responsible for your own risk tolerance and pain thresholds. Your own mileage will and should vary.
Disclosure: Long SPXU


Inner investor vs Inner trader ?
What percent of your overall portfolio do each hold?
Say you had a total of $1000….how long or short would you be ?
The bulk of my funds is with my inner investor. The trading account is small (single digit %) as a way of keeping me interested in the short-term market outlook.