Mid-week market update: Marketwatch recently highlighted analysis from NDR which concluded that sentiment was extended and while it may make sense to be cautious about adding risk, it’s too early to turn tactically bearish until readings recycle from an overbought condition.
I agree. I’ve been saying the same thing for several weeks. A correction or pullback is on the horizon, but hasn’t arrived yet. While signs of technical deterioration are appearing, a sideways consolidation marked by a rolling correction is very possible.
Here are the indicators that I’ve been watching, some of which have recycled and some have not.
Extended momentum
Here is one warning flag. The price momentum factor, or the propensity of stocks that are rising to continue rising, has become an extremely crowded trade at the 99.8 percentile, according to JPMorgan.
At the same time, the returns to the different price momentum ETFs have taken a recent stumble.
Bearish tripwires
Consistent with the downturn in momentum, the high flying technology stocks have been also been losing momentum. The relative performance of the NASDAQ 100 has already breached a rising trend line, and relative breadth indicators are deteriorating, but QQQ remains in an absolute uptrend. A break could be the signal for a deeper pullback.
The usually reliable S&P 500 Intermediate Breadth Momentum Oscillator (ITBM) is flashing a sell signal setup when its 14-day RSI became overbought. As well, the percentage of S&P 500 stocks above their 20 dma have also reached overbought territory, which is another warning of an extended market. I am waiting for the 14-day RSI to recycle from overbought to neutral, which would be a tactical sell signal. Not yet.
Suppressed volatility
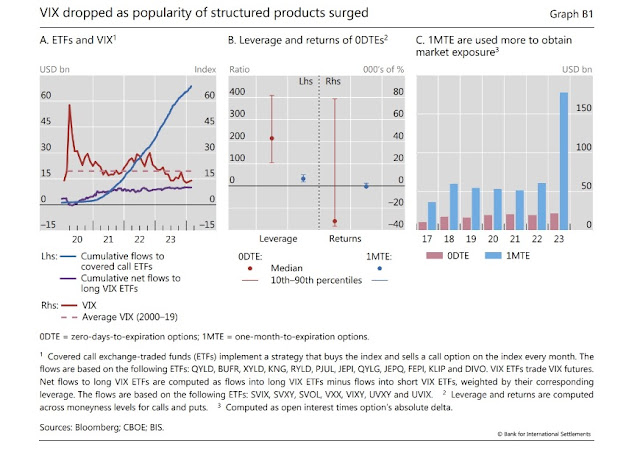
FT Alphaville pointed out that he long wait for a downside break in equity prices could be attributable to the flood of derivative-based yield enhancing products offered to investors. A BIS report explains how it all works:
A classic example of a yield-enhancing structured product is a so-called “covered call”: a purchase of the S&P 500 index and a simultaneous sale of a one-month call option on the index. The product gives an exposure to the index and generates a yield enhancement with the sale of the call option (the premium income), but it gives up part of the upside if the index rises above a threshold, say 5% over the next month. In other words, an investor in this covered call effectively takes the view that the market will not rise more than 5% over the next month and monetises this view by selling the call option. A covered call is just a simple illustration of a yield-enhancing structured product, but there are many more-complicated types. These structured products are frequently offered to retail investors by banks, which are often dealers.
Dealer hedging of the structure product leads to suppressed volatility:
The rise of yield-enhancing structured products may dampen volatility due to the mechanics of how dealers hedge option exposures. When dealers sell such structured products, they effectively buy an option from their clients. To hedge the option exposure, dealers trade in the underlying asset (the equity index) as a function of its price. Specifically, they need to buy when the index goes down and sell when it goes up – a practice known as “dynamic hedging”. By doing so, dealers act in a contrarian way, effectively dampening the price movements of the underlying asset. As volatility declines, so does the cost of ensuring against it, as reflected in option prices.
The article argues that this crowding is raising the risk of another Volmageddon, or a
sudden disorderly unwind of risk as dealers all rush for the exit in response to some unknown event
To get an idea of how much short-vol exposure is out there, market players can often be found adding up what’s known as vega. That’s a measure of how sensitive an option is to changes in volatility.
At Ambrus Group, another volatility hedge fund, an internal measure of vega aggregates options activity for the S&P 500 Index, the Cboe Volatility Index — a gauge of implied price swings in the US equity benchmark also known as the VIX — and the SPDR S&P 500 ETF Trust (SPY). Kris Sidial, co-chief investment officer, said in January the net short vega exposure was two times larger than in the run-up to the 2018 rout.
That means a 1-point increase in volatility could incur notional losses double those experienced six years ago. The big worry: Panicked investors unwinding positions as their losses mount could fuel more volatility, which causes more losses and more selling.


China is rising along with resources. Copper mining up 6% today with energy and materials strong.
The rise in copper price is due to output reduction from smelters in China, which implies more uncertainty in Chinese economy bubbling to the surface. It’s odd because Xi has been directing Chinese economy toward state-controlled companies. So it signals internal chaos. Or it may signal the coming slowing demand for EVs which uses a lot of copper per car. Copper price is at the same level as three years ago. A very long wait. Gold finally broke out after 3 and 1/2 years. But copper is not perceived as fiat money hedge.
Dynamic hedging sounds bad m’kay?
If things go against you don’t buy more no matter what you call it.
Fragility builds up, house of cards, jenga, no matter.
When it unwinds it could be bad. This grinding up like we are seeing is likely to end up violently. Unfortunately a lot of the things we look at like divergences of RSI, or stochastics may fail in this environment. So, does one get out now and risk watching the S&P go to 7000 or just hang on until there is a sharp break? Maybe the right idea is to start getting out, decrease risk but keep some on the table