Preface: Explaining our market timing models
We maintain several market timing models, each with differing time horizons. The “
Ultimate Market Timing Model” is a long-term market timing model based on the research outlined in our post,
Building the ultimate market timing model. This model tends to generate only a handful of signals each decade.
The
Trend Asset Allocation Model is an asset allocation model that applies trend-following principles based on the inputs of global stock and commodity prices. This model has a shorter time horizon and tends to turn over about 4-6 times a year. The performance and full details of a model portfolio based on the out-of-sample signals of the Trend Model can be found
here.
My inner trader uses a
trading model, which is a blend of price momentum (is the Trend Model becoming more bullish, or bearish?) and overbought/oversold extremes (don’t buy if the trend is overbought, and vice versa). Subscribers receive real-time alerts of model changes, and a hypothetical trading record of the email alerts is updated weekly
here. The hypothetical trading record of the trading model of the real-time alerts that began in March 2016 is shown below.
The latest signals of each model are as follows:
- Ultimate market timing model: Buy equities (Last changed from “sell” on 28-Jul-2023)
- Trend Model signal: Bullish (Last changed from “neutral” on 28-Jul-2023)
- Trading model: Neutral (Last changed from “bullish” on 24-Jan-2024)
Update schedule: I generally update model readings on my site on weekends. I am also on X/Twitter at @humblestudent. Subscribers receive real-time alerts of trading model changes, and a hypothetical trading record of those email alerts is shown here.
Subscribers can access the latest signal in real time here.
NASDAQ Hindenburg warnings
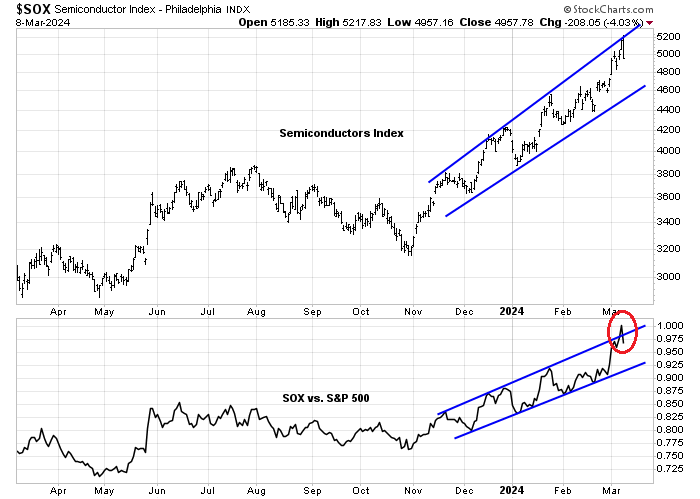
I have been concerned about the extended and frothy nature of the advance in growth stocks. Worries came to a head when the Semiconductors Index rallied through and reversed though an upward trending relative performance channel, indicating a possible blow-off top. Beneath the hood, however, market internals are signaling breadth deterioration for NASDAQ stocks that warn of an impending corrective downdraft.
The ominous sounding but controversial Hindenburg Omen was designed by James Miekka to spot major market tops, though it purportedly only has many false positives and a success rate of 25%. The indicator looks for the combination of an increasingly bifurcated market, as measured by breadth divergences, and a downside momentum break from an uptrend.
NASDAQ stocks have been flashing Hindenburg Omens starting in January and the warnings continued into February. While the signal isn’t perfect, the history of such clusters in the last 10 years has usually resolved in declines, shown as pink bars), while the instances of false positives (grey bars) have been relatively low.
I have been concerned about the extended nature of the advance in the last few weeks. A review of sector leadership suggests that while growth stocks are extended and due for a pullback, the overall market may hold up relatively well as it undergoes a rotational correction.
Stumbling growth
Even as financial headlines focus breathlessly on the success of AI-driven growth stocks, U.S. large-cap value bottomed out against growth in early February. The value turnaround appears to be global in nature, as it may have bottomed out in international developed markets in March.
The NASDAQ 100, which is mainly composed of large0cap growth stocks, is trading in an uptrend with hither highs and lower lows. However, when its performance is against the S&P 500, it topped out in January and relative breadth indicators have been deteriorating (bottom two panels).
A value and cyclical revival
Even as growth leadership stumbles, a review of the relative performance of the value and cyclical sectors shows two turning up (industrials and materials) and two flat against the S&P 500 (financials and energy).
Drilling down further, most cyclical industries are showing signs of relative strength, with the possible exception of transportation and metals and mining.
I am inclined to discount the relative weakness in metals and mining as one component, namely gold stocks, are exhibiting signs of strength (see Gold Miners: Refuge From the YOLO and FOMO Frenzy). While I am not a gold bug by nature, the latest upside breakout in the yellow metal looks like it has legs. Not only has gold staged an upside breakout to all-time highs, the gold-to-S&P 500 ratio is forming a long-term saucer-shaped bottom that could take bullion to considerable heights.
A probable rolling correction
While large-cap growth stocks are weakening, and they take up about 40% of S&P 500 weight, I don’t think that a stalling rally in growth will translate into a broader stock market pullback. To underline that point, the Hindenburg Omen history based on NYSE breadth only flashed one warning during the same period that the NASDAQ Hindenburg Omens saw a cluster of warnings. Historically, isolated instances of Hindenburg Omen signals tend to be false negatives.
Another reason for believing that a deeper correction isn’t imminent is the relative performance of defensive sectors. None are exhibiting strong signs of market leadership, indicating that the bears haven’t seized control of the tape.
In addition, NYSE and NASDAQ 52-week highs-lows remained positive even during the recent days of market declines, indicating underlying market strength.
As well, breadth is broadening out, which is a constructive sign. These readings lead to the conclusion that any market weakness should be fairly minor and corrective action by growth stocks would be offset by strength in value and cyclical names.
The week ahead
Looking to the week ahead, the market could be at an inflection point when growth stocks finally pull back after an extended advance. Friday saw an ominous bearish engulfing candle from AI bellwether and market leader NVIDIA, which could be the signal for a potential price momentum unwind. Before you become too bearish, this potentially bearish development needs to be confirmed by further weakness on Monday and beyond.
Similarly, Ryan Detrick observed that the S&P 500 traced out a doji candlestick last week, indicating indecision. A bearish reversal would need to be confirmed by a price decline next week.
However, I am not ready to turn tactically bearish just yet. The usually reliable S&P 500 Intermediate Term Breadth Oscillator (ITBM) just flashed a bearish setup when its 14-day RSI edged into overbought territory. It will flash a sell signal when the market weakens sufficiently for RSI to recycle to a neutral reading
In conclusion, my base-case scenario calls for a period of minor weakness in the S&P 500 or sideways consolidation, marked by a rolling correction. A review of market internals reveals weakness in growth stocks and better performance by value and cyclical stocks. The risk is a major scare in the extended growth names which drag down the S&P 500 further than I expect. If I had to guess, the probability of a deeper corrective action of -10% or more is no more than 25%.


A few candidates to consider for trading.
1. Perceived weakness in AI: AAPL, GOOGL
2. Nothing wrong: MELI
Synthetic longs or straight put writing.
3. Victim of algo trading: PFE. This one has good odds of retrace of at least 50%. COVID momentum done and GLP-1 no presence, but its oncology pipeline very promising from Seagen acquisition.
Synthetic long.