Preface: Explaining our market timing models
We maintain several market timing models, each with differing time horizons. The “
Ultimate Market Timing Model” is a long-term market timing model based on the research outlined in our post,
Building the ultimate market timing model. This model tends to generate only a handful of signals each decade.
The
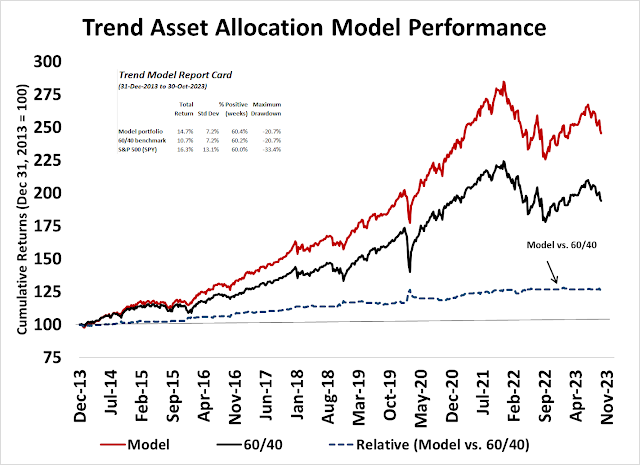
Trend Asset Allocation Model is an asset allocation model that applies trend-following principles based on the inputs of global stock and commodity prices. This model has a shorter time horizon and tends to turn over about 4-6 times a year. The performance and full details of a model portfolio based on the out-of-sample signals of the Trend Model can be found
here.
My inner trader uses a
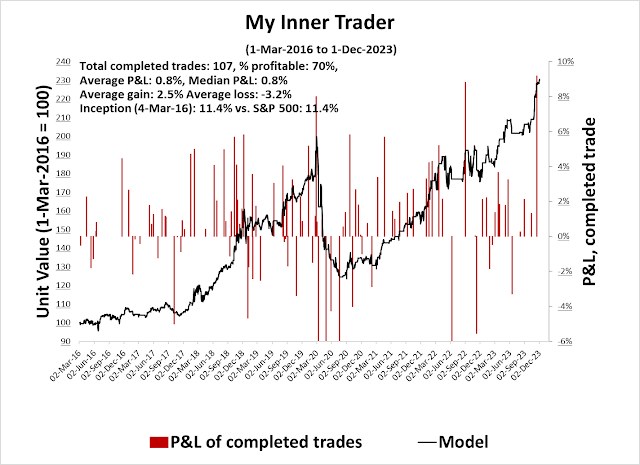
trading model, which is a blend of price momentum (is the Trend Model becoming more bullish, or bearish?) and overbought/oversold extremes (don’t buy if the trend is overbought, and vice versa). Subscribers receive real-time alerts of model changes, and a hypothetical trading record of the email alerts is updated weekly
here. The hypothetical trading record of the trading model of the real-time alerts that began in March 2016 is shown below.
The latest signals of each model are as follows:
- Ultimate market timing model: Buy equities (Last changed from “sell” on 28-Jul-2023)
- Trend Model signal: Bullish (Last changed from “neutral” on 28-Jul-2023)
- Trading model: Bullish (Last changed from “neutral” on 20-Nov-2023)
Update schedule: I generally update model readings on my site on weekends. I am also on X/Twitter at @humblestudent. Subscribers receive real-time alerts of trading model changes, and a hypothetical trading record of those email alerts is shown here.
Subscribers can access the latest signal in real time here.
Don’t overstay the party
Two weeks ago, I set out a number of bearish trigger warnings for investors (see How Far Can This Market Run?). Two signals have been triggered.
The NYSE McClellan Summation Index saw its weekly stochastic (bottom panel) edge into overbought territory. The NASDAQ McClellan Summation Index, which is not pictured, also reached a similar reading.
Don’t panic. These readings are only bearish set-ups and not immediate take-profit signals. Current conditions are consistent with a rally into year-end and possibly early January, but it is a warning not to overstay the party.
Still bullish
I remain tactically bullish. Other indicators that I outlined two weeks ago are not flashing sell signals. Neither the CBOE put/call ratio nor the equity-only put/call ratio has reached the froth zone, which I define as the bottom of the one-standard deviation around their 200 dma.
I also highlighted cryptocurrencies as a system liquidity indicator, which has also been correlated with the relative performance of speculative growth stocks such as the ARK Innovation ETF (ARKK). Both these indicators are still flashing green.
The market is also showing signs of broadening breadth, which is another constructive sign.
Low VIX = Complacency warning?
Other analysts have raised alarms over the low level of the VIX Index. Not only is option volatility low, but also interest in buying cheap put protection has been virtually non-existent. Is this a sign of complacency?
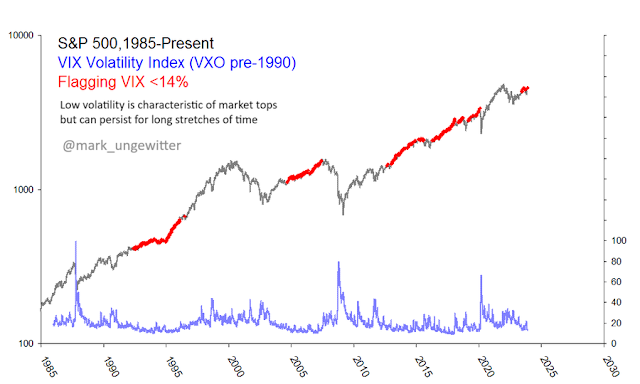
Don’t worry. Analysis by
Mark Ungewitter shows that VIX readings below 14 have historically been bullish for equities.
Even though the VIX Index has been relatively low by historical standards, the VVIX, which is the volatility of the VIX< has been elevated. I interpret this to be an early warning sign.
An analysis of the VVIX/VIX ratio (bottom panel) is revealing. My main takeaways from this analysis are:
- Peaks in the VVIX/VIX ratio lead past tops in the S&P 500.
- S&P 500 tops are usually proceeded by negative divergences in the VVIX/VIX ratio.
Our interpretation of this graph is this that is a sell signal set-up, but it’s too early to turn bearish just yet.
Don’t fight bullish seasonality
In conclusion, technical indicators are flashing very preliminary warning signs of an impending market top, but it’s too early for traders to take action. Price momentum is still positive and other bearish tripwires have not turned bearish yet. I are inclined to trust the seasonal pattern of December market strength. Historically, the first half of the month tends to be choppy and flat while the second half has been bullish.
Enjoy the party, but don’t overstay the festivities.
Both my inner investor and my inner trader are bullishly positioned. The usual disclaimers apply to my trading positions.
I would like to add a note about the disclosure of my trading account after discussions with some readers. I disclose the direction of my trading exposure to indicate any potential conflicts. I use leveraged ETFs because the account is a tax-deferred account that does not allow margin trading and my degree of exposure is a relatively small percentage of the account. It emphatically does not represent an endorsement that you should follow my use of these products to trade their own account. Leverage ETFs have a known decay problem that don’t make the suitable for anything other than short-term trading. You have to determine and be responsible for your own risk tolerance and pain thresholds. Your own mileage will and should vary.
Disclaimer: Long SPXL


Last weekend’s TWIST alert on Gold Miners worked out fantastically as did the previous weekend’s Base Metal Mining TWIST.
On Friday, there were TWISTs in TSX (Canada), S&P 600 Small Cap, Financials and Materials. Several were VERY close – S&P 900 large and medium cap, Consumer Discretionary, Utilities and Communications.
I give TWISTs three days to confirm (stay above TWIST closing price on Friday) before acting.
On rare occasions, TWISTs happen at the top of a surge in what I call an Exhaustion TWIST when the public buys at the top. This doesn’t look like that.
Both December 2024 Futures for Fed Funds and EURO Rates have plunged incredibly in the last few weeks. In my opinion, this is what’s kicked off this rally. Junk bond spreads are also tame.
The market gains are more broad-based as Cam mentioned.
I will say, I’m nervous that the extreme speculative stocks are leading now with the likes of ARKK, Blockchain, IPO, and Private Equity ETFs surging to the lead last week as the Magnificent Seven fell.
Gold Mining , base metals mining, Materials, Steel and Uranium are continuing strong.
BTW these are just opinions and not investment recommendations. I don’t know your risk tolerance or financial situation.
I wouldn’t worry about ARKK just yet.
Interesting that ARKK is rising while QQQ is struggling.
If the ARKK/QQQ ratio goes really parabolic then I’d worry. That’s why I am watching ARKK/TQQQ. See https://twitter.com/HumbleStudent/status/1730935601967374786
ARKK is the frothy side of meme stocks and shows speculative juices.
The Equal Weight S&P outperforming shows investors are buying what they think are bargains that have done poorly this year. Even the Dividend Aristocrat ETF is just turning positive YTD. so those stocks doing well can’t be judged as speculation.
My analysis, like Cam’s, indicates we are in a strong intermediate rally with fundamental and technical legs.
Short-term target for NYSI daily is 860 if we were to recover all losses of the three month correction right after Aug top. If this is a run-of-the mill price action we should start to see breadth going negative right around this number, and the NYSI RSI14 will start to descend from the current already very overbought level of 89.9. Based on recent price action in which we find many charts going almost vertical the drop should be sharp and quick. And we can reassess by then in terms of factor. It can certainly go over 860 and into 100 range which would be super bullish intermediate term.