The markets took a risk-on tone in the wake of a softer-than-expected CPI report, followed by a tame PPI report and strong retail sales print. Even before these reports, Mohamed El-Erian issued a warning about the goldilocks scenario of lower oil prices and falling bond yields.
Is market psychology in a “bad news is good news” mode that’s discounting weakness ahead? To answer that question, one useful way of seeing the world is through the lens of last week’s meeting between Joe Biden and Xi Jinping on the sidelines of the APEC Summit in San Francisco. The U.S. and China met to stabilize their relationship, but each is coming to the table with deep wounds, which are useful in evaluating potential weakness that could affect the global economy. The actual progress made at the meeting was modest, but it’s less important inasmuch as what it revealed about the vulnerabilities of each economy to the growth risks highlighted by El-Erian.
A wounded America
Biden goes into the meeting with a wounded America. Moody’s put the U.S. on credit watch for a possible downgrade, citing large fiscal deficits, fiscal paralysis and the headwinds from higher rates affecting debt service ability. Moreover, consumer confidence has been weakening.
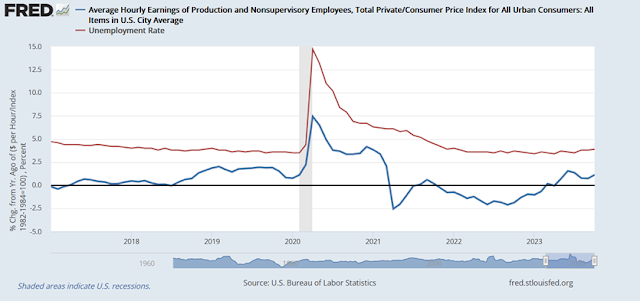
Real wages for non-supervisory workers, increased 3.3% between January 2017 and the end of 2019. Meanwhile the unemployment rate fell from 4.7% to 3.5%.
And that wasn’t just something ho-hum. In the case of real wages, they were the highest since the end of the 1970s. The unemployment rate was the lowest since the end of the 1960s.
The unemployment rate has varied between 3.4% and 3.9% in the past year, about even with Trump’s best year – but not better. More importantly, while real wages for non-supervisory workers are up 2.2% since right before the pandemic hit, measured from when Biden came into office they are actually down -1.5%.NDD went on to highlight the difficulty that households are experiencing under Biden, by comparing average hourly earnings (nominal, not real) for non-supervisory workers (in red) to house prices (dark blue) and mortgage payments (light blue). All of these values are set to 100 as of January 2021, so you can see what has happened during Biden’s administration.”


A long term chart of the US 2 year yield shows a possible topping pattern. Similar patterns occurred in 2000, 2006-2007 and late 2018, but the rates those times had to really drop a lot before bad things happened. We are not there yet, and usually most market downturns have had this drop in rates. Something to keep an eye on.
As an aside I read that mortgage refis are going up. Are people stressed and doing refis for cash they need now and hoping rates come back down so they can refi again later at a lower rate?
Cam, any guidance on what factors, asset classes, to focus on. The U.S. market has been 7 stocks in the index until just very recently?
Thanks
I am inclined to stay with the mega cap growth stocks for the time being. We are likely to get a Christmas rally in small caps after tax-loss selling season.
Thanks cam, have a peaceful Thanksgiving! By the way, very impressive market and macro calls this year!