Preface: Explaining our market timing models
The latest signals of each model are as follows:
- Ultimate market timing model: Buy equities (Last changed from “sell” on 28-Jul-2023)
- Trend Model signal: Bullish (Last changed from “neutral” on 28-Jul-2023)
- Trading model: Neutral (Last changed from “bullish” on 11-Oct-2023)
Update schedule: I generally update model readings on my site on weekends. I am also on X/Twitter at @humblestudent. Subscribers receive real-time alerts of trading model changes, and a hypothetical trading record of those email alerts is shown here.
Subscribers can access the latest signal in real time here.
Rebound from a panic bottom
Did you buy in at the bottom? I highlighted how insider purchases (blue line) exceeded insider sales (red line) in late September. Such episodes have signaled low-risk entry points into stocks in the past. Indeed, a market rebound appears to be under way. While past buy signals have resolved in relief rallies, not all were durable.
I believe the current market rebound from the recent lows will be long lasting. Here are three reasons why.
Supportive market structure
Firstly, the technical outlook of the market structure is unabashedly bullish. My models are filled with numerous intermediate-term buy signals. The usually reliable S&P 500 Intermediate Breadth Momentum Oscillator (ITBM) flashed a buy signal last week when its 14-day RSI recycled from oversold to neutral. In the past, ITBM buy signal failures have occurred when the advance was too far advanced, as measured by the percentage of S&P 500 stocks above their 20 dma rising to 65%, which is not the case this time. The history of ITBM shows that the advance generally doesn’t stall until either the 14-day RSI becomes overbought or the percentage of stocks above their 20 dma becomes overbought. I interpret this to mean that this rally has legs.
Looking out longer term, the S&P 500 experienced a breadth wipeout and recycle when the percentage of S&P 500 stocks above their 50 dma fell below and rose back above 10%. Historically, subsequent rallies from such events don’t end until the indicator becomes overbought and reaches at least 80%, indicating further upside potential.
Similarly, the percentage of S&P 500 bullish on point and figure charts fell below 30% and recycled. Past instances in the past 10 years have also generally resolved with strong rallies.
Supportive risk appetite indicators
Risk appetite indicators are also supportive of further stock market strength. The relative performance of global consumer discretionary to staples stocks is holding up remarkably well in the face of the recent market turmoil.
Credit market risk appetite, as measured by the relative performance of junk bonds, is exhibiting a minor positive divergence against the S&P 500..
Supportive sentiment
Sentiment models are also supportive of a strong advance. Marketwatch reported that Goldman Sachs found that CTAs, which are mainly trend-following hedge funds, are short equities at the zero percentile over the last 10 years, and “CTAs are now buyers of SPX in every scenario over the next month”.
In a separate report. Goldman’s prime brokerage arm reported that the aggregate position of U.S. long/short equity hedge funds is at a five-year low.
In other words, a rebound from these oversold levels is likely to set off a FOMO scramble for risk into year-end.
Key risks
The other is geopolitical risk. By now, the world is well aware of the surprise attack on Israel and the Israeli response. A less well-known development is a possible rapprochement between Iran and Saudi Arabia, as evidenced by a readout of a phone call between Saudi Crown Prince Mohammed bin Salman and Iranian President Ebrahim Raisi.
HRH the Crown Prince emphasized that the Kingdom is exerting maximum effort to engage with all international and regional parties to halt the ongoing escalation, and he asserted the Kingdom’s opposition to any form of civilian targeting and the loss of innocent lives.
He stressed the necessity of adhering to the principles of international humanitarian law and expressed deep concern for the dire humanitarian situation in Gaza and its impact on civilians.
HRH the Crown Prince also underscored the Kingdom’s unwavering stance in standing up for the Palestinian Cause and supporting efforts aimed at achieving comprehensive and fair peace that ensures the Palestinian people’s legitimate rights.
The week ahead
Looking to the week ahead, the S&P 500 rally stalled just below its 50 dma and a gap from late September when the VIX Index recycled from above its upper Bollinger Band to its 20 dma.
Earnings season is just kicking off. FactSet reports that forward 12-month EPS estimates are still rising, which is an indicator of bullish positive fundamental momentum.
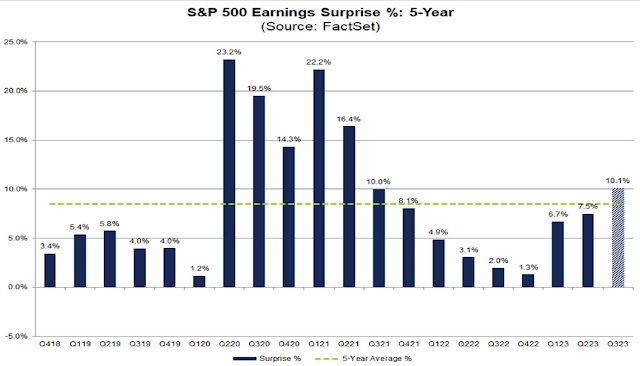
The reports from major banks were well received by the market. One notable feature of the bank reports is the reduction in loan loss provisions in the face of fears over a slowing economy. This is a cautiously positive sign from the banking industry. In addition, the highly preliminary earnings surprise rate has trended up compared to recent quarters, though it’s very early in Q3 reporting season,
In conclusion, the financial markets are recovering from a very oversold condition and extreme positioning. The recovery has already sparked a minor risk-on rebound. Bullish momentum should continue to spark a FOMO stampede for risk into year-end.
2 thoughts on “3 reasons why stocks should rally into year-end”
Comments are closed.


Sorry, I had a typo: Revised from:
Trading model: Neutral (Last changed from “neutral” on 11-Oct-2023)
To
Trading model: Neutral (Last changed from “bullish” on 11-Oct-2023)
Cam,
If the FOMO rally is likely to unfold into year end, what should trigger the entry? Why is the trading model neutral?