Preface: Explaining our market timing models

The latest signals of each model are as follows:
- Ultimate market timing model: Buy equities (Last changed from “sell” on 28-Jul-2023)
- Trend Model signal: Bullish (Last changed from “neutral” on 28-Jul-2023)
- Trading model: Bullish (Last changed from “neutral” on 22-Sep-2023)
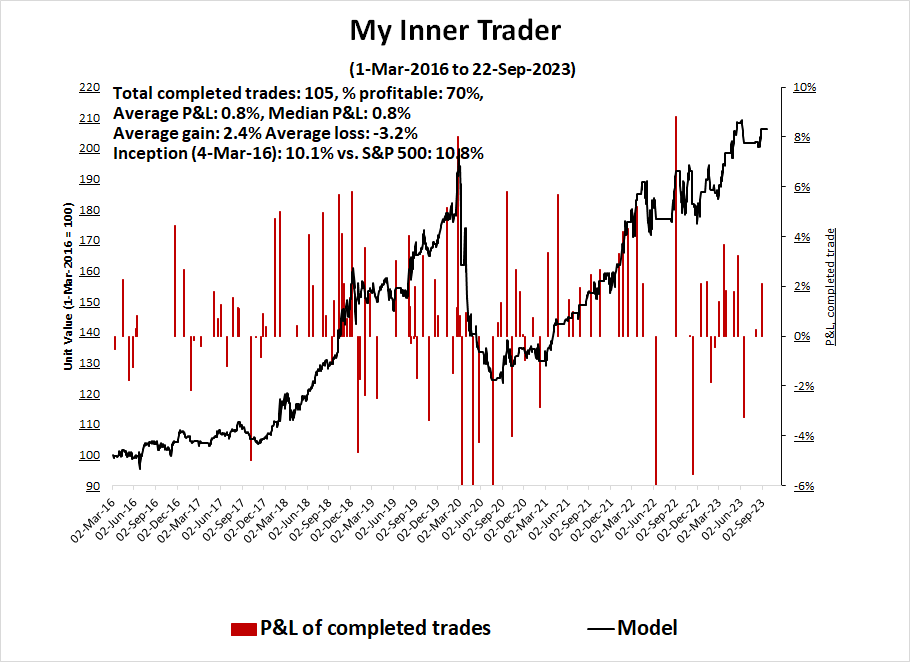
Update schedule: I generally update model readings on my site on weekends. I am also on X/Twitter at @humblestudent. Subscribers receive real-time alerts of trading model changes, and a hypothetical trading record of those email alerts is shown here.
Subscribers can access the latest signal in real time here.
VIX as fear gauge
There have been a series of recent articles highlighting the subdued level of the VIX Index and the seasonal tendency for equity volatility to spike this time of year (see this Barron’s article as an example). Other analysts have speculated that the VIX Index is failing as a fear gauge.
Indeed, the current explosion in 0DTE trading, or options that expire the same day, makes a 1-month implied volatility have less utility as a sentiment indicator. Arguably, VXST, or the 9-day VIX, is more useful to measure short-term sentiment. The accompanying chart shows that VXST was faster to spike in the current instance than VIX. The term structure of the VIX-VXST curve shows an inversion, which is an indication of fear appearing in the market.

The key question for investors is whether fear levels are high enough for a short-term bottom.
Regular readers will recall my Trifecta Bottom Spotting Model, which was triggered under the following circumstances:
2. TRIN spikes above 2, which indicates price-insensitive selling, or a “margin clerk market”; and
3. The intermediate-term overbought/oversold model, which is the ratio of the percentage of stocks above their 50 dma to percentage above their 150 dma, falls below 0.5, which is an oversold condition.

Can support hold?
I pointed out in the past that whenever the 5-week RSI of the S&P 500 reached over 90, the market pulled back, rallied and weakened to test the previous low. My base case in the latest pullback called for initial S&P 500 support at about 4350, with secondary support at the 200 dma at about 4200. Now that the index has reached 4350, can this initial support hold?

In addition, two of the four components of my Bottom Spotting Model flashed a buy signal after the market close on Thursday when the VIX Index spiked above its upper Bollinger Band and NYMO oversold. Such conditions have been bullish signals with strong risk/rewards in the past.

Additionally, Samantha LaDuc reported that dealers are massively short the VIX to the zero percentile over the survey period. By implication, they are massively long equities.

The bear case
Keep in mind, however, that oversold markets can become more oversold. It’s possible that the market may need a final flush before a durable bottom can be made, indicating further downside potential.
An analysis of market internals reveals a series of negative divergences. While the S&P 500 tests its August lows, other indicators are showing a series of lower highs and lower lows.

A scan of other high-beta groups, such as small-caps, and the cyclically sensitive home construction and semiconductor stocks, are tracing out head and shoulders technical patterns with considerable downside potential.

Technical analyst Wayne Whaley conducted a historical study and found that years with similar return patterns as 2023 saw a bearish final week of September, followed by strong price recoveries in each of the remaining months of the year.

Before you become too bearish, Ryan Detrick conducted a more detailed historical study of daily S&P 500 seasonality and found that the last two weeks of September tend to be negative, thought the returns in the final week were less bearish. In practice, much will depend on the level of market anxiety over the prospect and possible effects of a U.S. government shutdown on September 30, though the historical evidence shows that shutdowns have had little or no effect on stock prices.

That said, the latest update from FactSet shows the first decline in forward 12-month EPS estimates in some time. It remains to be seen whether the downward revision was just a data blip or the start of a bear trend.

In summary, I rhetorically asked if the VIX has lost its usefulness as a fear gauge. In this era of 0DTE option trading, VXST is a more useful sentiment indicator, and readings are indicating a fear spike. The market has become sufficiently short-term oversold that a relief rally is imminent. However, oversold markets can become more oversold and market internals could be supportive of one final sentiment flush before a durable bottom can be seen. If the market were to weaken further from here, strong S&P 500 support could be found at its 200 dma at about 4200. I estimate the odds of the market holding support at the current level at roughly 75% and further weakness down to 4200 at about 25%.
I would like to add a note about the disclosure of my trading account after discussions with some readers. I disclose the direction of my trading exposure to indicate any potential conflicts. I use leveraged ETFs because the account is a tax-deferred account that does not allow margin trading and my degree of exposure is a relatively small percentage of the account. It emphatically does not represent an endorsement that you should follow my use of these products to trade their own account. Leverage ETFs have a known decay problem that don’t make the suitable for anything other than short-term trading. You have to determine and be responsible for your own risk tolerance and pain thresholds. Your own mileage will and should vary.
Disclosure: Long SPXL
The Factor setup for this correction was not bear market. Of the four Factors, Growth, Value Low Volatility and Small Company, Volatility was the worst performer. At bull market peaks, Low Volatility is leading not lagging as portfolio managers have shifted to safer ground.
There are other doors out of the current situation:
1. Sideways till middle of October when more inflation data is available
2. A deeper correction similar to August, 2022.
What are the odds?